How to Set Up Multi-Region Uptime Monitoring for Global SaaS
Learn how to design a multi-region uptime monitoring strategy that catches regional outages before your global customers do.

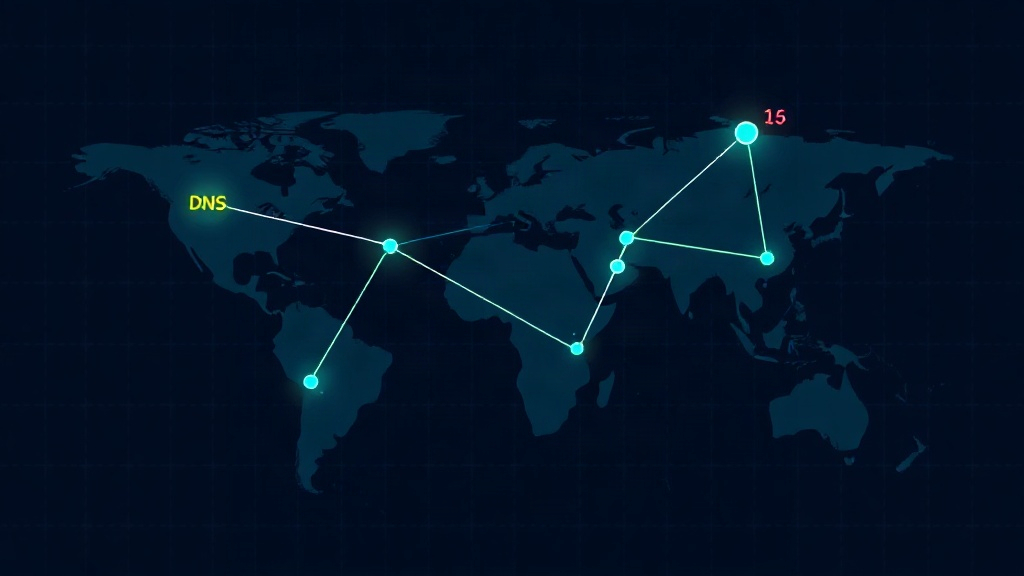
TL;DR: Single-region monitoring misses regional ISP issues, CDN edge failures, and DNS propagation problems that only affect subsets of your users. Set up monitors from at least 4-6 geographically distributed regions, align check locations with your actual user base, use consensus-based alerting to avoid false positives, and route incidents to region-aware on-call schedules. This guide walks through the full setup.
Why Single-Region Monitoring Fails Global SaaS Products
If you run a SaaS product with customers in North America, Europe, and Asia-Pacific, monitoring from a single US-East data center tells you almost nothing about the experience your Singapore or Frankfurt customers actually have. Regional ISP routing issues, undersea cable cuts, DNS resolver problems, and CDN edge node failures are all invisible from one vantage point.
In 2026, distributed infrastructure is the norm — most SaaS products run on multi-region cloud deployments with edge caching, regional load balancers, and geo-routed DNS. Your monitoring strategy needs to match that architecture, or you'll get support tickets before you get alerts.
A real-world example: a checkout API hosted on AWS us-east-1 with a CloudFront distribution can look perfectly healthy to a US-based monitor while EU users experience 8-second TLS handshake delays due to a misconfigured edge location. Only a monitor physically checking from Frankfurt or Amsterdam catches that.
Step 1: Map Your Monitoring Regions to Your User Base
Start with your actual traffic data, not guesses. Pull your analytics or CDN logs and identify where your top 80% of users connect from.
A typical global SaaS distribution looks like:
- North America (US East, US West)
- Europe (Frankfurt, London, or Amsterdam)
- Asia-Pacific (Singapore, Tokyo, or Sydney)
- South America (São Paulo) — if you have LatAm customers
- Middle East / Africa — only if traffic justifies it
Don't monitor from regions with negligible traffic just because it's available. Every additional region adds noise and cost without proportional value. Six well-chosen regions almost always outperform twelve arbitrary ones.
Step 2: Choose the Right Check Types Per Region
Not every check needs to run everywhere. Layer your monitoring by what actually varies regionally:
- HTTP/HTTPS checks — run from every region; response time and availability differ significantly by geography
- DNS resolution checks — run from every region since resolvers and propagation differ
- SSL/TLS certificate checks — only need to run from 1-2 regions since certs don't change per location
- API endpoint checks with auth — run from every region if you have region-specific API gateways or load balancers
- Synthetic transaction checks (login, checkout flow) — run from at least 2-3 major regions to catch functional issues, not just availability
This layered approach keeps your monitor count manageable while still catching the failures that matter.
Step 3: Set Up Consensus-Based Alerting
The biggest mistake teams make with multi-region monitoring is treating every regional check failure as an independent incident. A single flaky network hop in Singapore shouldn't page your entire on-call rotation.
Instead, use consensus rules:
- Require 2 out of 3 (or 3 out of 5) regions to report a failure before triggering a critical alert
- Treat single-region failures as warnings that auto-resolve if they clear within 2-3 check cycles
- Escalate to critical only when failures persist across multiple regions or exceed a duration threshold (e.g., 5 minutes)
Livstat's monitoring engine supports this kind of multi-location consensus checking out of the box, which cuts false-positive alerts dramatically compared to single-check-location tools. Teams that switch from single-region to consensus-based multi-region monitoring typically report 60-70% fewer false alerts in the first month.
Step 4: Configure Region-Aware Escalation Policies
Once you know an outage is regional rather than global, route the alert accordingly:
- Regional outage → notify the on-call engineer covering that geography or the infra team responsible for that region's deployment
- Global outage → trigger your full incident response workflow, including status page updates and customer notifications
- Follow-the-sun teams → make sure escalation policies account for time zones so a 3am regional alert in APAC doesn't wake up someone in the US who can't act on it anyway
This is where escalation workflows and multi-region monitoring intersect — your alerting logic needs to know not just that something failed, but where.
Step 5: Build a Status Page That Reflects Regional Health
Global customers want to know if an issue affects them specifically. A status page that just says "API: Operational" or "API: Degraded" without regional breakdown forces customers to guess.
Best practice for 2026:
- Break out components by region (e.g., "API - US", "API - EU", "API - APAC")
- Show real-time latency graphs per region so customers can self-diagnose
- Auto-update component status based on your monitor consensus rules, not manual intervention
- Include a note when an issue is regional-only so unaffected customers don't panic
This level of transparency reduces support ticket volume significantly — customers in unaffected regions can see for themselves that everything's fine on their end.
Step 6: Test Your Setup With Simulated Regional Failures
Don't wait for a real outage to find out your consensus rules or escalation paths are misconfigured. Run periodic game days:
- Temporarily block traffic from one region using a firewall rule or feature flag
- Confirm your monitors detect the regional-only failure
- Verify the correct on-call engineer gets paged, not the entire team
- Check that your status page correctly reflects a regional (not global) incident
- Document any gaps and adjust thresholds or routing rules
Run this exercise quarterly, especially after adding new regions or changing your CDN/DNS provider.
Common Pitfalls to Avoid
- Over-monitoring: Adding every available check location "just in case" creates alert fatigue and inflates your monitoring bill without improving detection.
- Ignoring DNS propagation delays: A DNS change can look fully propagated in one region and still be stale in another for hours.
- Treating latency and availability the same: A region reporting 200 OK with 6-second response times isn't "up" — set separate latency thresholds per region based on realistic baselines.
- Forgetting mobile networks: Desktop broadband and mobile carrier routing can behave very differently in the same city; if mobile usage is high, consider checks that account for that.
Key Takeaway
Multi-region uptime monitoring isn't about running more checks — it's about running the right checks from the right places, then using consensus logic to separate real global incidents from isolated regional blips. Map your monitors to your actual user distribution, layer your check types intelligently, and make sure your status page and escalation policies reflect regional reality. Get this right, and you'll catch the outages that matter while cutting the noise that doesn't — before your customers on the other side of the world even notice.