Status pages your customers will actually check
Beautiful status pages with built-in monitoring, automatic incident detection, and subscriber notifications. Setup in 2 minutes.
No credit card required · Free tier available
150+
Status pages created
420+
Monitors active
4.8M+
Checks performed
5
Global regions
Up and running in 3 steps
No servers to manage, no config files to write
Add components
List the services your customers depend on — API, dashboard, CDN, database. Each gets its own uptime bar.
Configure monitors
Attach HTTP, TCP, or SSL monitors. Livstat checks from up to 5 regions every 30 seconds and auto-detects outages.
Share your status page
Publish at yourslug.livstat.com or your own custom domain. Visitors can subscribe for email alerts.
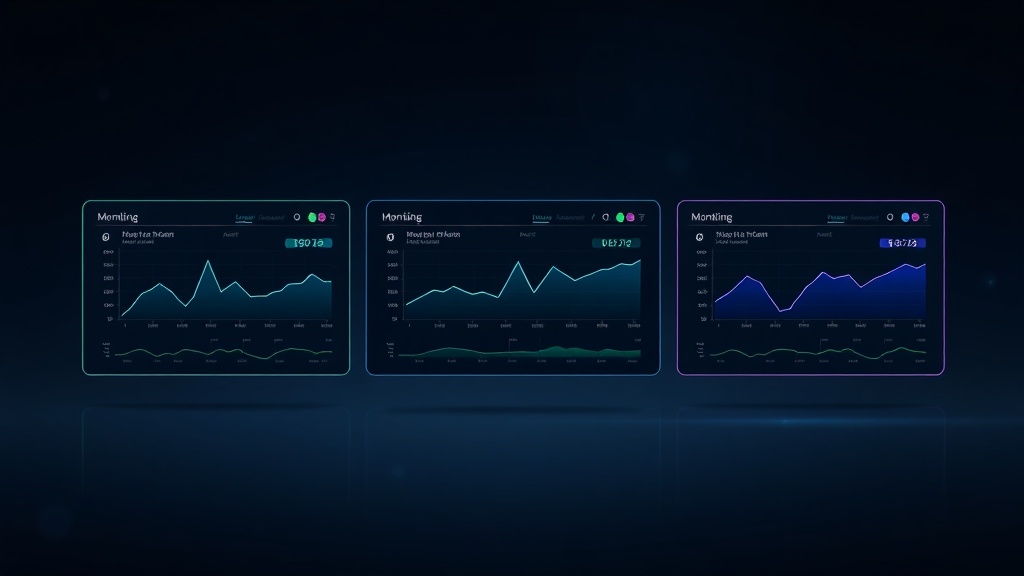
See it in action
This is our own status page — we use Livstat to monitor Livstat
Components
- API REST API and webhook delivery99.87% uptime Operational30 days ago 90 days ago Today
- Website livstat.com landing page100% uptime Operational30 days ago 90 days ago Today
- Dashboard App dashboard and user interface99.94% uptime Operational30 days ago 90 days ago Today
- MCP Server Model Context Protocol for AI99.81% uptime Operational30 days ago 90 days ago Today
- Database & Queue PostgreSQL + NATS100% uptime Operational30 days ago 90 days ago Today
Incident History (last 14 days)
Dashboard Login Page is down
Mar 25, 2026
Get Notified
Subscribe to receive email notifications when incidents are created or resolved.
Everything you need for status communication
Multi-region monitoring
HTTP, TCP & SSL checks from 5 global regions every 30 seconds. Consensus-based alerting eliminates false positives.
Beautiful status pages
Custom domain, branding, dark mode. Your status page looks like part of your product, not a third-party tool.
Instant notifications
Email, Slack, Discord, webhooks, PagerDuty. Your team knows immediately. Subscribers get email updates.
Automatic incidents
Monitors detect issues and create incidents automatically. Or create them manually with full timeline and post-mortems.
90-day uptime history
Visual uptime bars, response time graphs, and SLA tracking. Show your users you care about reliability.
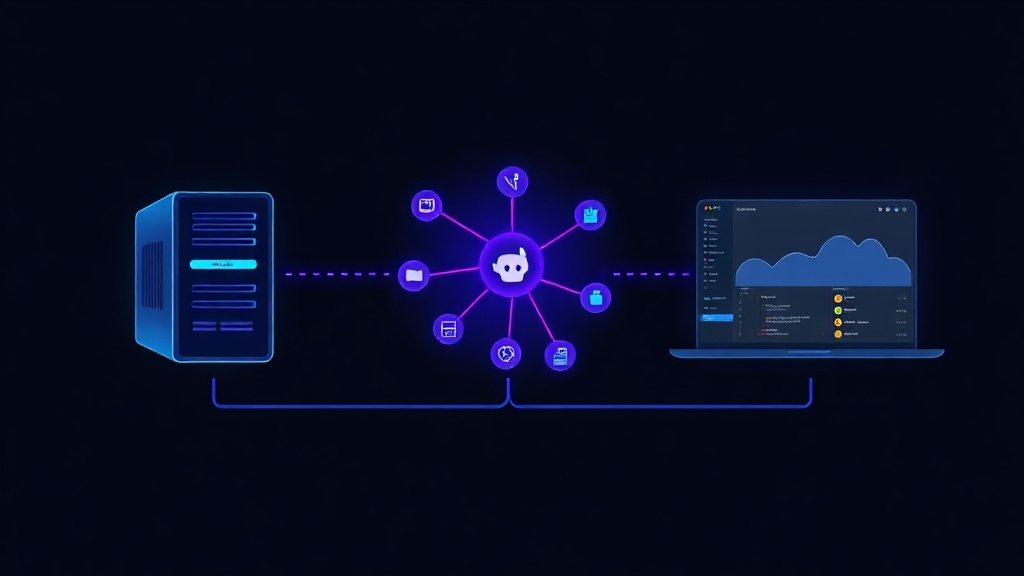
API-first + Claude MCP
Full REST API, webhooks, and MCP server for Claude. Manage incidents and component statuses via natural language.
Simple, transparent pricing
Statuspage charges $79+/mo for the same features
Free
forever free
- ✓ 1 status page
- ✓ 5 components
- ✓ 5 monitors
- ✓ 1 region
- ✓ 5 min check interval
- ✓ 100 subscribers
- ✓ 30-day history
- ✓ API & Claude MCP
Pro
billed monthly
- ✓ 3 status pages
- ✓ 20 components
- ✓ 20 monitors
- ✓ 3 regions
- ✓ 1 min check interval
- ✓ 1,000 subscribers
- ✓ Custom domain
- ✓ Slack & Discord
- ✓ Claude MCP
- ✓ 365-day history
Business
billed monthly
- ✓ 10 status pages
- ✓ 50 components
- ✓ 50 monitors
- ✓ 5 regions
- ✓ 30s check interval
- ✓ 5,000 subscribers
- ✓ Custom CSS
- ✓ Remove branding
- ✓ PagerDuty
- ✓ API access
- ✓ Claude MCP
Frequently asked questions
From our blog
Insights on status pages, monitoring, and reliability.
BetterStack vs Livstat vs UptimeRobot: Which Wins in 2026
A practical, feature-by-feature comparison of BetterStack, Livstat, and UptimeRobot to help you pick the right status page and monitoring tool in 2026.
Cachet vs Upptime vs Livstat: Open-Source vs Hosted Status Pages
Comparing Cachet, Upptime, and Livstat for 2026: setup time, maintenance burden, monitoring depth, and total cost of ownership — so you pick the right status page for your team.

How to Calculate and Monitor SLA Compliance for Status Pages
Learn proven methods to accurately calculate SLA compliance metrics, implement automated monitoring, and maintain transparency through your status page. Essential guide for DevOps and site reliability teams.