How to Add a Live Uptime Badge to Your GitHub README
Learn how to add a real-time uptime badge to your GitHub README in minutes — boost trust with contributors, users, and hiring managers browsing your repo.
TL;DR: A live uptime badge shows real-time status directly in your GitHub README using a dynamic image URL from your monitoring tool. Set up a monitor in Livstat (or any uptime tool with badge support), grab the Markdown snippet, and paste it under your project title. It takes less than five minutes and instantly builds credibility for open-source projects, APIs, and side projects.
Why a README Badge Matters More Than You Think
GitHub badges are the first thing visitors see after your project title. Build status, license, and version badges are standard — but an uptime badge tells a different story: this project is alive and actively maintained.
If you maintain a public API, a self-hosted tool, or a SaaS product with an open-source component, a live uptime badge answers a question every visitor silently asks: "Is this thing still running?" A green "99.98% uptime" badge answers that instantly, without anyone opening an issue to ask.
This is especially valuable for:
- API projects where consumers need to know if the demo endpoint is live
- Open-source status page tools (meta, but common)
- Side projects with a hosted demo you want recruiters or users to trust
- Internal tools shared across teams via GitHub wikis
What You Need Before You Start
You don't need a full incident management platform to pull this off. You just need three things:
- A monitor tracking the URL, API endpoint, or service you want to show status for
- A monitoring tool that generates a dynamic, publicly accessible badge image (SVG or PNG)
- Five minutes to edit your
README.md
Most modern uptime tools — including Livstat — generate a badge URL automatically once a monitor is created, no extra configuration required.
Step 1: Create a Monitor
Start by setting up a monitor for the service you want to badge. In Livstat, this takes under a minute:
- Log in to your Livstat dashboard
- Click Add Monitor
- Enter the URL, API endpoint, or ping target (HTTP, TCP, or keyword-based checks all work)
- Set your check interval — 30 seconds to 5 minutes is typical for public-facing badges
- Save the monitor
Once it's live, Livstat starts collecting uptime data immediately, which is what powers the badge.
Step 2: Enable Public Badge Sharing
Most monitoring tools require you to explicitly make a monitor's badge public — this protects private infrastructure from being exposed accidentally.
In Livstat:
- Open the monitor you just created
- Go to the Sharing or Badge tab
- Toggle Public Badge on
- Choose your badge style — options typically include uptime percentage, current status (up/down), or response time
You'll get a unique URL like:
https://livstat.com/badge/your-monitor-id.svg
This URL renders a live SVG image that updates automatically as your monitor's status changes — no manual refresh needed.
Step 3: Add the Badge to Your README
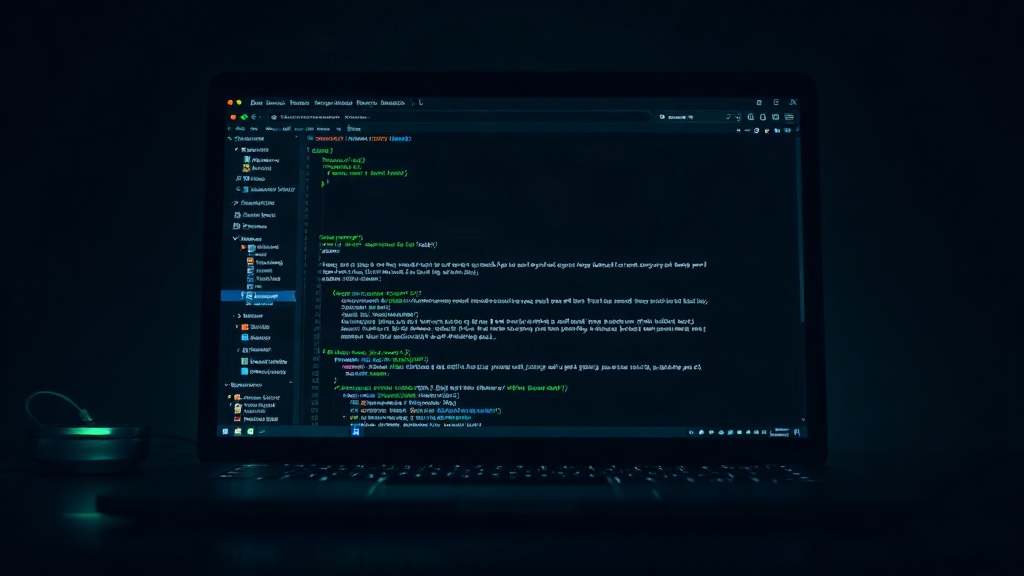
GitHub renders Markdown images directly, so embedding the badge is just one line:

For a clickable badge that links back to your public status page, wrap it in a link:
[](https://status.yourproject.com)
Place it near the top of your README, right under the title and alongside other badges like build status or license:
# My Project
[](https://github.com/you/repo/actions)
[](https://status.yourproject.com)
[](LICENSE)
Commit the change, push, and the badge appears instantly on your repo's main page.
Customizing the Badge
Most badge generators let you tweak:
- Label text — e.g., "API Status" instead of the default "Uptime"
- Color thresholds — green above 99%, yellow between 95–99%, red below that
- Metric shown — uptime percentage, live status (operational/down), or average response time
- Style — flat, flat-square, or plastic, matching shields.io conventions many developers expect
If your project has multiple services (API, dashboard, docs site), consider adding one badge per critical component instead of a single combined badge. This gives visitors granular insight instead of a vague overall status.
Common Mistakes to Avoid
- Badging a monitor with a 24-hour check interval. Slow checks mean the badge lags behind reality. Use intervals of 5 minutes or less for anything public-facing.
- Forgetting to make the badge public. A private monitor badge will either 404 or show a broken image on GitHub — always test the raw URL in an incognito browser tab first.
- Overcrowding the README with too many badges. Stick to 3–5 badges max: build, uptime, license, and maybe version or downloads.
- Not linking the badge to a status page. A badge alone shows a snapshot; linking it to a full status page lets visitors see uptime history and past incidents.
Real-World Example
Say you maintain an open-source webhook relay tool with a hosted demo at demo.yourproject.dev. Without a badge, a new visitor has no idea if that demo link even works — until they click it and hit a timeout. That's a bad first impression and a common reason contributors bounce.
With a live uptime badge showing "99.95% uptime — Operational" right in the README, you remove that doubt before anyone clicks anything. It's a small detail, but it compounds: projects that look actively maintained get more stars, more contributors, and more trust from people evaluating them for production use.
Taking It Further: Full Status Pages
A badge is a great entry point, but if your project or product has real users depending on uptime, pair it with a full public status page. A dedicated status page gives you:
- Historical uptime charts going back 90+ days
- Incident timelines with root cause explanations
- Subscriber notifications via email or Slack when status changes
- Multi-monitor dashboards for complex systems
Livstat lets you spin up both the badge and a full status page from the same monitor setup, so you're not maintaining two separate tools for one piece of information.
Key Takeaway
Adding a live uptime badge to your GitHub README is one of the highest-leverage, lowest-effort trust signals you can add to a project. It takes under five minutes, requires no code changes beyond a single Markdown line, and immediately communicates that your project is maintained and monitored.
Start with one monitor, grab the badge URL, and drop it into your README today — your next visitor will notice.