How to Set Up Status Page Monitoring for Streaming Media Platforms (2026)
Learn how to monitor and communicate uptime for video, audio, and live streaming platforms — from CDN edges to DRM and playback failures.
TL;DR: Streaming platforms fail in ways generic uptime checks miss — buffering, DRM errors, CDN edge failures, and encoding pipeline breakdowns. Monitor at every layer (origin, CDN, playback, DRM, transcoding) and use a status page to segment incidents by region and content type so viewers and stakeholders know exactly what's affected.
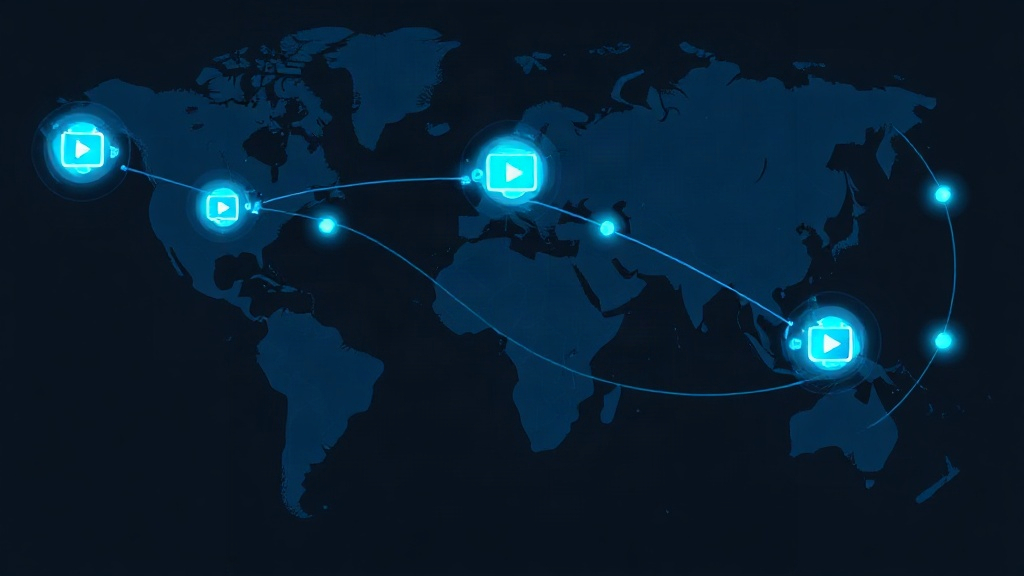
Streaming media platforms don't go down like a typical website. A video service can have a fully healthy origin server while millions of viewers still see spinning buffer icons because a single CDN edge node in Frankfurt is misbehaving. Traditional "is it up or down" monitoring doesn't capture that nuance — and that's exactly why streaming companies need a more layered approach.
In 2026, viewers have zero patience for playback issues. A Nielsen-style expectation has emerged across the industry: if a stream stutters for more than a few seconds, over 60% of viewers will switch to another app rather than wait it out. That makes proactive monitoring and clear incident communication a retention strategy, not just an ops nice-to-have.
Why Streaming Platforms Need Specialized Monitoring
A streaming stack has more moving parts than a typical SaaS app:
- Ingest and encoding pipelines that transcode raw video into multiple bitrates
- Origin servers storing master copies of content
- CDN edge nodes distributed globally to serve viewers with low latency
- DRM and licensing servers that authorize playback
- Playback APIs (manifest files, HLS/DASH segments) that clients pull from
- Authentication and billing systems gating access to content
Any one of these can fail independently while the others stay green. A single "platform is up" indicator hides too much — you need visibility into each layer, and a status page that reflects that granularity to your users.
Step 1: Map Your Streaming Pipeline Into Monitorable Components
Start by breaking your service into discrete components that map to what actually affects the viewer experience. A useful baseline:
- Ingest/Live Encoding — is your live stream ingest accepting feeds and encoding without dropped frames?
- VOD Transcoding Queue — is new content processing on schedule, or backing up?
- Origin Storage — are master files and manifests accessible?
- CDN Delivery (per region) — are edge nodes in North America, EU, APAC, etc. serving segments with acceptable latency?
- DRM/License Server — are playback licenses issuing successfully?
- Playback API / Manifest Server — are HLS/DASH manifests resolving correctly?
- Authentication & Subscription Gateway — can users log in and validate entitlements?
Each of these should become its own monitor — and ideally its own component on your public status page, grouped logically (e.g., "Live Streaming," "On-Demand Library," "Account & Billing").
Step 2: Set Up Synthetic Playback Checks, Not Just Pings
A 200 OK response from your CDN doesn't mean video is actually playable. Synthetic monitoring for streaming needs to go deeper:
- Manifest validation: Fetch the HLS/DASH manifest and confirm it references valid, recent segments.
- Segment fetch tests: Pull actual video segments from multiple CDN POPs and measure download time and integrity.
- DRM handshake tests: Simulate a license request end-to-end to confirm playback authorization works, not just that the server responds.
- Startup time tracking: Measure time-to-first-frame from multiple geographic checkpoints — this is often the metric most correlated with viewer churn.
Run these checks from multiple regions every 1-5 minutes. A CDN issue in Southeast Asia might never show up if all your checks run from a single US data center.
Step 3: Monitor CDN Health Region by Region
CDN failures are rarely global — they're usually a specific POP, ISP peering issue, or regional routing problem. Build your monitoring (and your status page) around regions, not just a single global check:
- Deploy monitors from at least 4-6 geographic regions matching your major viewer bases
- Track segment delivery latency and error rates per region
- Set alert thresholds tighter for live events than for VOD (a 2-second delay during a live sports broadcast is far more damaging than during on-demand playback)
On your status page, this translates into regional components: "CDN — North America," "CDN — Europe," "CDN — APAC." This lets you communicate "streaming is degraded in APAC only" instead of alarming your entire global user base over a localized issue.
Step 4: Track Live Event Uptime Separately From VOD
Live streaming and video-on-demand have very different failure tolerances. A VOD glitch inconveniences one viewer at a time; a live event outage during a championship game or product launch is a reputation-defining event watched by thousands simultaneously.
- Create dedicated, time-boxed monitors for scheduled live events
- Use tighter check intervals (every 30-60 seconds) during live windows
- Pre-stage a status page incident template specifically for live event disruptions, so your team can post updates within seconds, not minutes
Step 5: Monitor DRM and Authentication Separately From Playback
A huge percentage of "streaming is down" complaints are actually authentication or DRM failures, not video delivery issues. Users see a black screen or error code and assume the whole platform is broken.
- Set up a dedicated monitor hitting your DRM license server
- Track license issuance latency and failure rate
- Alert separately from playback/CDN monitors so your on-call team can immediately identify whether it's a rights/licensing issue or a delivery issue
This separation matters for your public status page too — labeling an incident "DRM licensing degraded" versus "video playback degraded" gives users and your support team much clearer expectations.
Step 6: Build a Status Page That Matches How Viewers Actually Experience Your Service
Your internal monitoring can have 40 granular checks — your public status page shouldn't. Group components the way a viewer thinks about your product:
- Live Streaming
- On-Demand Library
- Mobile Apps (iOS/Android)
- Smart TV Apps (Roku, Fire TV, Apple TV)
- Account, Billing & Login
- Regional Delivery (if you serve multiple continents)
With Livstat, you can map each of these to underlying monitors and automatically reflect degraded/partial outage states without manually flipping toggles during an incident — which matters a lot when your team is scrambling during a live event failure.
Step 7: Automate Incident Detection and Escalation
Manual incident declaration is too slow for streaming, where viewer complaints spike within seconds of a playback failure. Set up:
- Automatic incident creation when synthetic playback checks fail from 2+ regions simultaneously
- Escalation policies that page your video infrastructure on-call team directly, bypassing general support queues
- Auto-updates to your status page component status based on monitor state, so the page reflects reality before your support team even gets the first ticket
Step 8: Post-Incident: Track MTTR by Failure Type
After each incident, tag it by root cause layer (CDN, DRM, encoding, origin, auth) and track mean time to resolution per category. Over a few quarters, this reveals your weakest layer — often it's CDN failover configuration or DRM server capacity during traffic spikes — and gives you data to justify infrastructure investment.
Key Takeaway
Streaming platforms fail in layers, not as a single unit — and generic uptime monitoring will always be a step behind viewer complaints. Build monitoring around the actual playback pipeline (ingest, CDN, DRM, manifests), segment by region and live vs. VOD, and structure your status page around how viewers actually experience your product. Do this well, and you'll often detect and communicate issues before your support inbox even lights up.