How to Reduce Alert Fatigue in On-Call Rotations (2026 Guide)
Alert fatigue burns out engineers and delays real incident response. Here's a practical framework to cut noise, sharpen signal, and build sustainable on-call rotations in 2026.
TL;DR: Alert fatigue happens when engineers get so many low-value pages that they start ignoring or delaying responses to real incidents. Fix it by tiering alert severity, tying alerts to symptoms not causes, auto-resolving flapping alerts, rotating fairly, and reviewing your alert data monthly. Tools like Livstat help by centralizing monitoring and routing only meaningful alerts to the right people.
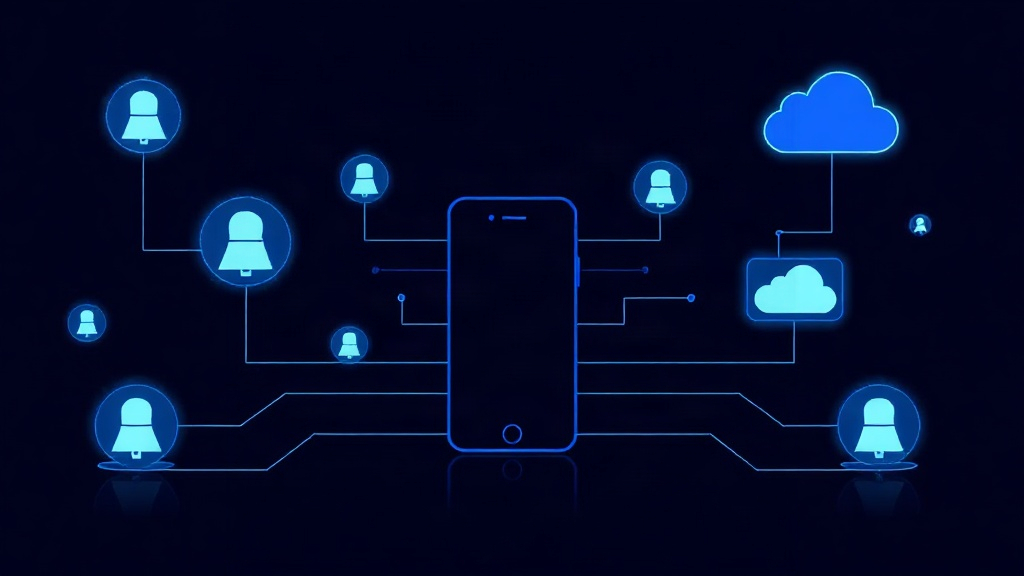
Alert fatigue is the silent killer of on-call programs. A 2026 survey of SRE teams found that engineers on rotation receive an average of 15-20 alerts per shift, but fewer than a third require immediate action. The rest are noise — flapping checks, duplicate pages, and alerts for issues that self-resolve in minutes.
When every alert feels urgent, none of them do. Engineers start muting notifications, delaying acknowledgments, or tuning out entirely — right when a real outage hits.
Here's how to fix it.
Why Alert Fatigue Happens
Most alert fatigue traces back to a few root causes:
- Overly sensitive thresholds that trigger on normal variance, not actual degradation
- Cause-based alerting (e.g., "CPU at 85%") instead of symptom-based alerting (e.g., "API latency exceeds SLA")
- No deduplication, so one root issue triggers 10 separate pages across services
- Flat severity, where a typo in a log message pages the same way as a full outage
- Unbalanced rotations, where the same one or two engineers absorb most of the pages
The fix isn't fewer monitors — it's smarter alerting logic.
Step 1: Alert on Symptoms, Not Causes
Instead of paging on every resource metric that crosses a threshold, page on what actually affects users.
- Bad: "Memory usage on server-3 is at 90%"
- Good: "Checkout API error rate exceeds 5% for 3 minutes"
Symptom-based alerts correlate directly with customer impact, which means every page is actionable by definition. Save resource-level metrics for dashboards, not pages.
Step 2: Build a Real Severity Hierarchy
Not every alert deserves a phone call at 2 a.m. Structure your alerts into clear tiers:
- P1 — Critical: Full outage or major functionality broken. Immediate page, escalates automatically if unacknowledged.
- P2 — High: Degraded performance affecting a subset of users. Page during business hours, escalate after a delay off-hours.
- P3 — Low: Minor issues, non-customer-facing. Goes to a ticket queue or Slack channel, no page.
- Informational: Logged only, reviewed in daily standups.
If more than 20% of your pages fall into P3 territory, your severity mapping needs work. Every critical page should mean something is actually broken for users.
Step 3: Deduplicate and Correlate Alerts
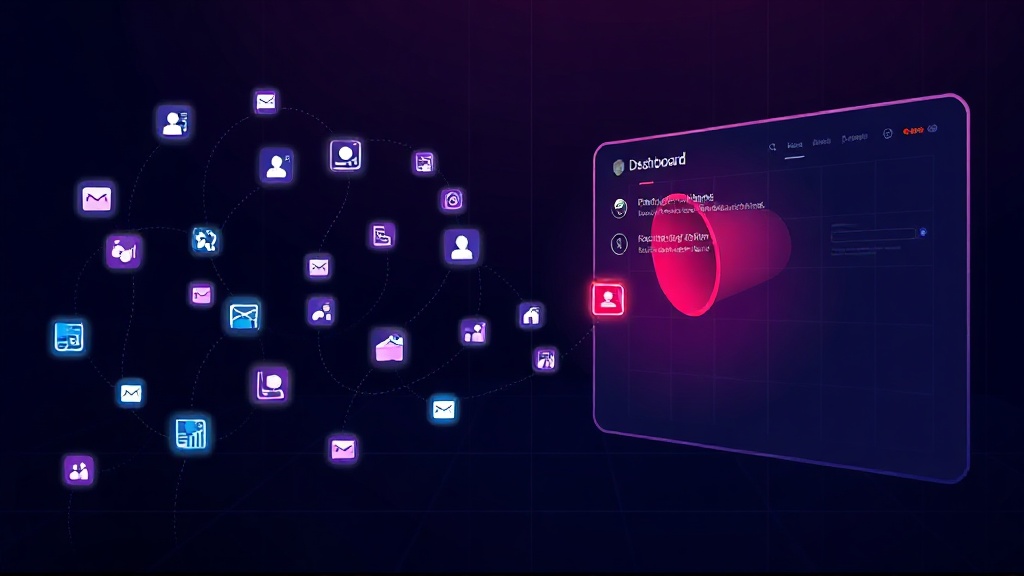
A single database failure can trigger alerts from your API, your job queue, your cache layer, and your frontend — all within seconds. Without correlation, that's four pages for one incident.
- Group alerts by root cause using time-window correlation (alerts within 60-90 seconds of each other tied to the same service dependency)
- Use a single incident record that aggregates related alerts instead of spawning parallel pages
- Suppress downstream alerts once an upstream root cause is identified
This alone can cut alert volume by 40-60% in dependency-heavy architectures, according to incident management benchmarks from 2025-2026.
Step 4: Auto-Resolve Flapping Alerts
Flapping — when a check fails and recovers repeatedly — is one of the biggest fatigue sources. If a monitor bounces between up and down every few minutes, it shouldn't generate a fresh page each time.
- Require an alert to persist for a minimum duration (e.g., 2-3 consecutive failed checks) before paging
- Auto-close alerts that self-resolve within a defined window
- Track flapping monitors separately and fix the underlying instability instead of tuning around it
Livstat's monitoring lets you set failure-confirmation thresholds per monitor, so a single blip in a health check doesn't turn into a 3 a.m. page.
Step 5: Route Alerts to the Right Owner
Misrouted alerts are a huge, underrated fatigue driver. If a database alert pages a frontend engineer who has no context or ability to act, it just delays resolution and erodes trust in the system.
- Map every service and monitor to a specific owning team
- Use escalation policies that route based on service ownership, not a single catch-all rotation
- Make sure secondary and tertiary escalation paths are staffed with people who can actually fix the issue
If you haven't already, pair this with structured escalation workflows for critical systems so alerts always land with someone who can act, not just someone who's on call.
Step 6: Design Fair, Sustainable Rotations
Even with perfect alert tuning, a badly designed rotation creates burnout.
- Keep on-call shifts to 5-7 days maximum
- Rotate at least 4-6 people per service to avoid the same person absorbing repeat pages
- Track total pages per person per month — if one engineer consistently gets 3x the pages of teammates, redistribute ownership or fix the underlying noisy service
- Give engineers comp time or a lighter sprint load after a heavy on-call week
- Avoid stacking on-call with other high-stress responsibilities (e.g., don't put someone on call during a major release week)
Step 7: Run a Monthly Alert Review
Alert fatigue creeps back in without regular maintenance. Schedule a recurring review where the team looks at:
- Total alerts fired vs. alerts that led to real action
- Top 5 noisiest monitors by volume
- Average time to acknowledge and resolve
- Any monitor with a false-positive rate above 20%
Use this data to retune thresholds, merge redundant checks, or downgrade severity on monitors that consistently turn out to be non-issues. Treat your alerting configuration like code — it needs version control, review, and iteration.
Step 8: Measure the Right Metrics
To know if your fatigue-reduction efforts are working, track:
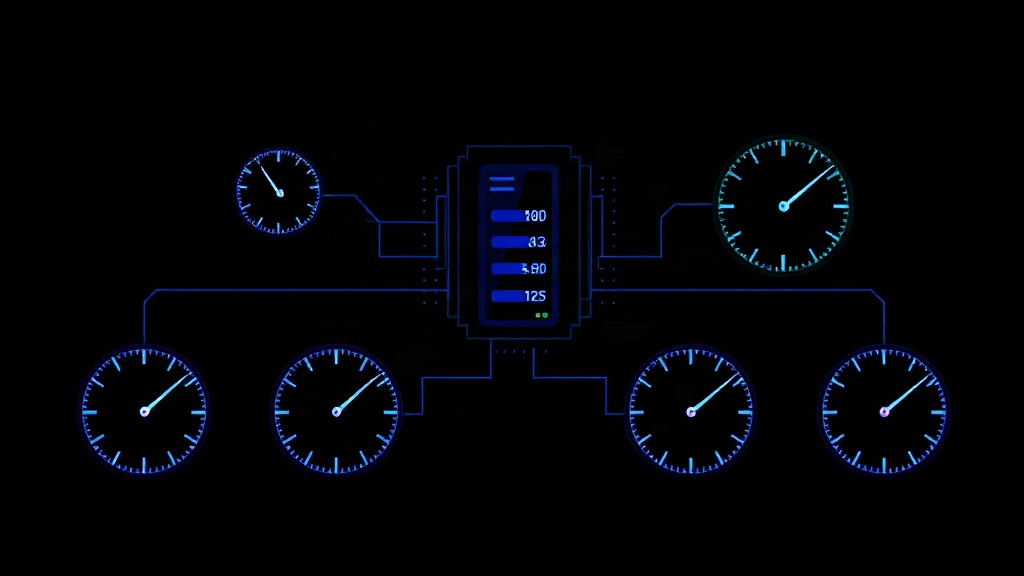
- Pages per on-call shift (target: under 5 for a healthy rotation)
- Percentage of alerts requiring action (target: above 80%)
- Mean time to acknowledge — rising MTTA is often an early fatigue signal
- On-call engineer turnover or opt-out requests — a leading indicator of burnout
If MTTA is creeping up month over month even as alert volume stays flat, that's a fatigue signal, not a staffing signal.
Key Takeaway
Alert fatigue isn't solved by hiring more people or buying more monitoring tools — it's solved by making every alert count. Tier your severities, alert on symptoms, deduplicate aggressively, and review your data monthly.
A rotation where engineers trust that every page matters is a rotation that responds faster, burns out less, and keeps your systems — and your team — healthy long term.