How to Set Up Incident Response Automation for SaaS Platforms 2026
Learn how to build automated incident response systems that detect, escalate, and communicate issues without manual intervention. Complete guide with tools, workflows, and best practices for 2026.
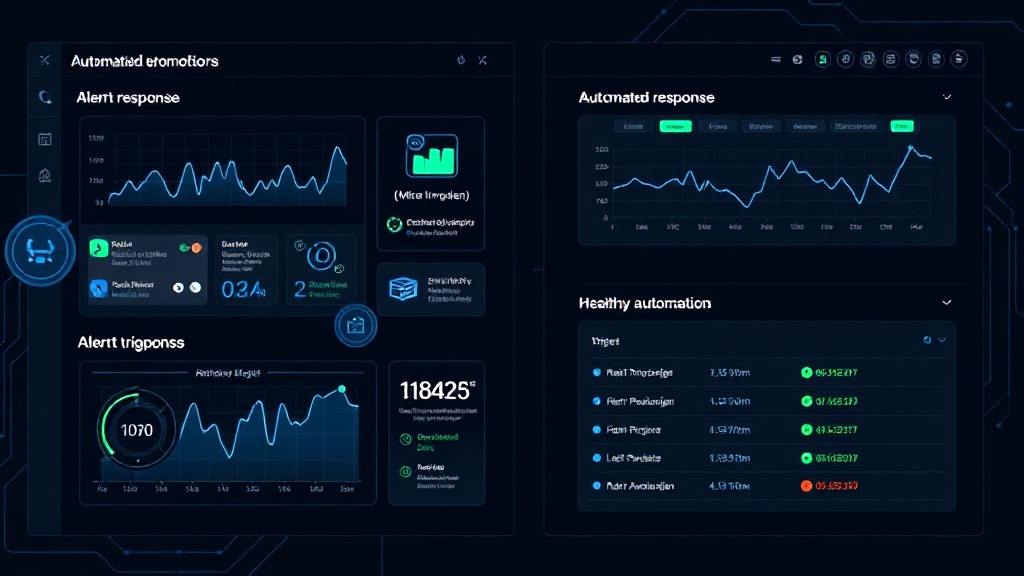
TL;DR: Incident response automation reduces mean time to resolution by 60-80% through automated detection, escalation, and communication workflows. This guide covers setting up monitoring triggers, notification systems, escalation policies, and recovery automation for SaaS platforms in 2026.
Why Incident Response Automation Matters in 2026
Manual incident response is no longer viable for modern SaaS platforms. With customers expecting 99.9% uptime and sub-second response times, every minute of downtime costs an average of $9,000 for enterprise applications.
Automated incident response systems can detect issues in seconds rather than minutes, notify the right people immediately, and even initiate recovery procedures without human intervention. Companies using full automation report 75% faster incident resolution and 40% fewer customer-impacting outages.
Core Components of Incident Response Automation
Detection and Monitoring Layer
Your automation starts with comprehensive monitoring that goes beyond simple uptime checks. Set up these monitoring types:
- Synthetic monitoring: Automated tests that simulate user journeys
- Real user monitoring (RUM): Track actual user experience metrics
- Infrastructure monitoring: CPU, memory, disk, and network metrics
- Application performance monitoring (APM): Database queries, API response times
- Log aggregation: Error patterns and anomaly detection
Alert Routing and Escalation
Configure smart routing rules that send alerts to the right person based on:
- Severity level (P1 for customer-facing, P2 for degraded performance)
- Service ownership (team responsible for the affected component)
- Time of day and on-call schedules
- Geographic location for follow-the-sun support
Communication and Status Updates
Automate customer communication through:
- Status page updates triggered by monitoring alerts
- Email notifications to affected customer segments
- Slack/Teams integration for internal coordination
- Social media posting for major incidents
Step 1: Set Up Monitoring and Detection
Choose Your Monitoring Stack
Select tools that integrate well together and support API-driven automation:
- Prometheus + Grafana: Open-source option with excellent alerting
- Datadog: Comprehensive APM with built-in automation features
- New Relic: Strong on application monitoring and anomaly detection
- PagerDuty: Incident management with powerful automation workflows
Configure Detection Rules
Create monitoring rules that balance sensitivity with noise reduction:
# Example Prometheus alerting rule
groups:
  - name: api_alerts
    rules:
    - alert: APIResponseTimeCritical
      expr: histogram_quantile(0.95, rate(http_request_duration_seconds_bucket[5m])) > 2
      for: 2m
      labels:
        severity: critical
        component: api
      annotations:
        summary: "API response time above 2 seconds for 2 minutes"
Set thresholds based on your SLA requirements. If you promise 99.9% uptime, configure alerts to trigger before you breach those commitments.
Implement Anomaly Detection
Modern platforms use machine learning to detect unusual patterns:
- Traffic spikes that differ from historical patterns
- Error rate increases beyond normal variance
- Resource utilization trending toward saturation
- Performance degradation across multiple metrics
Step 2: Build Automated Escalation Workflows
Define Escalation Policies
Create clear escalation paths that account for different scenarios:
- Level 1: On-call engineer notified immediately
- Level 2: Team lead engaged after 10 minutes of no acknowledgment
- Level 3: Manager and backup team notified after 20 minutes
- Level 4: Executive escalation for customer-facing incidents over 30 minutes
Set Up On-Call Rotations
Implement fair and sustainable on-call schedules:
- Weekly rotations with clear handoff procedures
- Follow-the-sun coverage for global operations
- Backup assignments for each primary on-call person
- Automatic failover if primary doesn't acknowledge within 5 minutes
Configure Smart Routing
Route incidents based on metadata and context:
# Example routing logic
def route_incident(alert):
    if alert.component == "payment_api":
        return "payments_team"
    elif alert.severity == "critical" and alert.customer_impact:
        return "platform_team"
    else:
        return "general_oncall"
Step 3: Automate Communication and Updates
Status Page Integration
Connect your monitoring directly to your status page for instant updates. Many platforms like Livstat offer API-driven incident creation that can be triggered automatically when critical alerts fire.
Configure automatic status updates based on alert severity:
- Critical alerts: Create incident and set status to "Major Outage"
- Warning alerts: Create incident with "Performance Issues" status
- Recovery: Auto-resolve incidents when metrics return to normal
Customer Communication Templates
Prepare templates for different incident types:
- Initial notification: "We're investigating reports of [issue description]"
- Update with timeline: "We've identified the cause and expect resolution within [timeframe]"
- Resolution: "The issue has been resolved. All services are operating normally"
Internal Coordination
Set up automated Slack channels or Teams channels for each incident:
// Example Slack automation
function createIncidentChannel(incident) {
  const channelName = `incident-${incident.id}-${incident.component}`;

  slack.conversations.create({
    name: channelName,
    is_private: false
  });

  // Invite relevant team members
  slack.conversations.invite({
    channel: channelName,
    users: getTeamMembers(incident.component)
  });
}
Step 4: Implement Automated Recovery Actions
Safe Automation Actions
Start with low-risk automated responses:
- Service restarts: Automatically restart failed containers or processes
- Traffic rerouting: Redirect traffic from failing instances to healthy ones
- Resource scaling: Auto-scale resources when utilization thresholds are exceeded
- Cache clearing: Flush caches that might contain stale data
Circuit Breaker Patterns
Implement circuit breakers that automatically isolate failing components:
class CircuitBreaker:
    def __init__(self, failure_threshold=5, timeout=60):
        self.failure_count = 0
        self.failure_threshold = failure_threshold
        self.timeout = timeout
        self.last_failure_time = None
        self.state = "CLOSED"  # CLOSED, OPEN, HALF_OPEN

    def call(self, func, *args, **kwargs):
        if self.state == "OPEN":
            if time.time() - self.last_failure_time > self.timeout:
                self.state = "HALF_OPEN"
            else:
                raise Exception("Circuit breaker is OPEN")

        try:
            result = func(*args, **kwargs)
            self.on_success()
            return result
        except Exception as e:
            self.on_failure()
            raise e
Rollback Automation
Set up automatic rollbacks for deployment-related incidents:
- Monitor key metrics during deployments
- Automatically roll back if error rates spike
- Implement blue-green deployment switches
- Use feature flags to disable problematic features
Step 5: Testing and Continuous Improvement
Chaos Engineering
Regularly test your automation with controlled failures:
- Chaos Monkey: Randomly terminate instances to test recovery
- Network partitioning: Simulate network failures between services
- Resource exhaustion: Consume CPU/memory to test scaling automation
- Dependency failures: Simulate third-party service outages
Runbook Automation
Convert manual runbooks into executable scripts:
#!/bin/bash
# Automated database failover runbook

echo "Starting automated failover procedure..."

# Check primary database health
if ! pg_isready -h primary-db.example.com -p 5432; then
  echo "Primary database is down, initiating failover"

  # Promote secondary to primary
  pg_ctl promote -D /var/lib/postgresql/data

  # Update load balancer configuration
  kubectl patch service postgres-service --patch '{"spec":{"selector":{"role":"primary"}}}'

  # Notify teams
  slack_notify "Database failover completed successfully"
fi
Metrics and Optimization
Track these key metrics to optimize your automation:
- Mean Time to Detection (MTTD): How quickly incidents are detected
- Mean Time to Resolution (MTTR): Total time from detection to resolution
- False positive rate: Percentage of alerts that aren't real issues
- Escalation rate: How often incidents require human intervention
Advanced Automation Strategies
AI-Powered Root Cause Analysis
Implement machine learning models that can predict and identify root causes:
- Correlation analysis between different metrics
- Historical pattern matching for similar incidents
- Natural language processing of error logs
- Predictive modeling to prevent incidents before they occur
Self-Healing Infrastructure
Build systems that can repair themselves:
- Kubernetes operators that maintain desired state
- Auto-scaling groups that replace unhealthy instances
- Database clustering with automatic failover
- Content delivery networks with intelligent routing
Security Considerations
Ensure your automation doesn't create security vulnerabilities:
- Principle of least privilege: Automation should have minimal required permissions
- Audit logging: Track all automated actions for compliance
- Rate limiting: Prevent automation from causing cascading failures
- Human oversight: Critical actions should require approval or manual confirmation
Conclusion
Incident response automation isn't just about faster response times—it's about building resilient systems that can handle the complexity of modern SaaS platforms. Start with monitoring and basic escalation, then gradually add more sophisticated automation as your team gains confidence.
Remember that automation should augment human expertise, not replace it entirely. The goal is to handle routine issues automatically while ensuring your team can focus on complex problems that require creative thinking and domain knowledge.
By implementing these automation strategies in 2026, you'll reduce incident impact, improve customer satisfaction, and create more sustainable on-call practices for your engineering teams.