How to Set Up Status Page Monitoring for Serverless Functions
Learn to monitor AWS Lambda, Azure Functions, and Google Cloud Functions with proper status page implementation. Includes automated alerts, custom metrics, and incident response workflows.
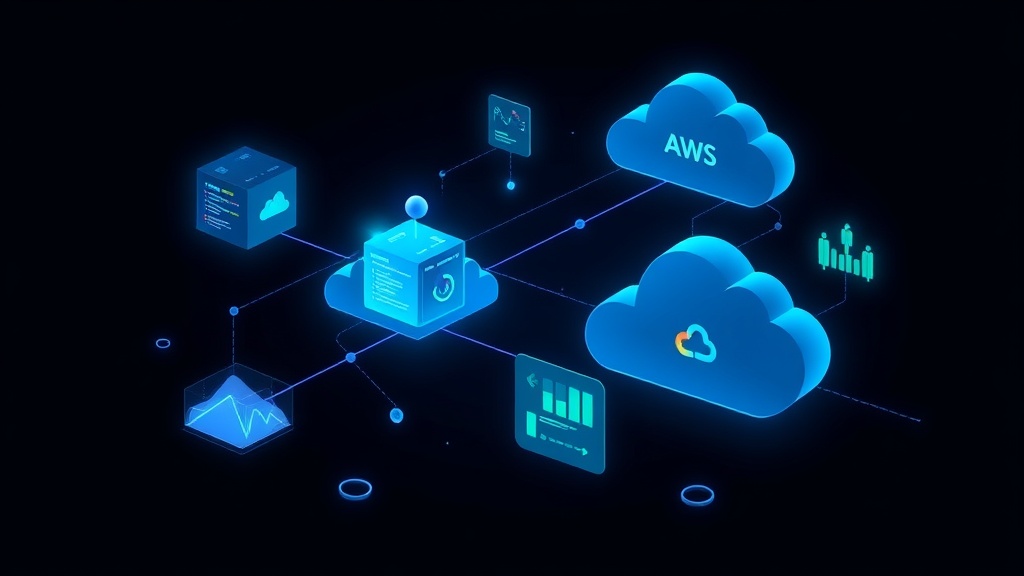
TL;DR: Monitoring serverless functions requires tracking invocations, duration, errors, and cold starts across multiple providers. Set up synthetic monitoring, configure custom metrics, implement automated alerting, and create clear incident communication workflows. Most platforms offer built-in monitoring, but dedicated status page solutions provide better customer-facing transparency.
Understanding Serverless Function Monitoring Challenges
Serverless functions operate differently from traditional servers, creating unique monitoring requirements. You can't simply ping a URL or check CPU usage when your code only runs on-demand.
The ephemeral nature of serverless functions means they appear and disappear based on traffic patterns. This creates blind spots in traditional monitoring approaches that expect persistent infrastructure.
Cold starts add another layer of complexity. When a function hasn't been invoked recently, the first request experiences additional latency as the runtime environment initializes. Your monitoring needs to distinguish between normal cold start delays and actual performance issues.
Key Metrics for Serverless Function Monitoring
Successful serverless monitoring focuses on four critical metrics:
Invocation Count tracks how often your functions execute. Sudden spikes might indicate abuse or viral growth, while unexpected drops could signal integration failures or upstream issues.
Duration Metrics measure execution time from start to finish. Monitor average, 95th percentile, and maximum duration to catch performance degradation before it impacts users.
Error Rates capture both handled exceptions and unhandled failures. AWS Lambda reports errors differently than Azure Functions, so normalize your metrics across providers for consistent alerting.
Cold Start Frequency affects user experience significantly. Track the percentage of invocations that experience cold starts, especially for user-facing functions where latency matters.
Setting Up Provider-Specific Monitoring
AWS Lambda Monitoring
AWS CloudWatch provides comprehensive Lambda metrics out of the box. Enable detailed monitoring for sub-minute granularity on critical functions.
Create custom CloudWatch dashboards for each service or application boundary. Group related Lambda functions together to understand system-level health.
Set up CloudWatch Alarms for duration thresholds, error rates above 1%, and invocation count anomalies. Use composite alarms to reduce noise from correlated failures.
Invocations > 1000/minute AND Errors > 5% = Critical Alert
Duration > P95 baseline + 2 standard deviations = Performance Warning
ConcurrentExecutions > 80% of reserved capacity = Scaling Alert
Azure Functions Monitoring
Application Insights integrates seamlessly with Azure Functions for detailed telemetry. Enable sampling for high-volume functions to control costs while maintaining visibility.
Configure availability tests to verify function endpoints from multiple geographic regions. This catches regional outages that internal monitoring might miss.
Use Azure Monitor action groups to route alerts through multiple channels. Critical serverless function failures should trigger immediate notifications to on-call teams.
Google Cloud Functions Monitoring
Cloud Monitoring offers built-in dashboards for Cloud Functions with execution time, memory usage, and active instances. Create custom metrics for business-specific monitoring needs.
Implement structured logging with severity levels. Google Cloud Functions automatically parse JSON logs, making it easier to create log-based metrics and alerts.
Set up uptime checks for HTTP-triggered functions. These synthetic transactions verify end-to-end functionality from external perspectives.
Implementing Synthetic Monitoring
Synthetic monitoring proactively tests serverless functions by simulating user interactions. This catches issues before real users encounter problems.
Create test scenarios that exercise your functions' most critical paths. For an image processing function, upload a test image and verify the output meets quality standards.
Schedule synthetic tests to run every 1-5 minutes for critical functions. Less critical functions can use 15-minute intervals to balance coverage with resource consumption.
Distribute synthetic tests across multiple regions to catch localized failures. A function might work perfectly from Virginia but timeout from Oregon due to downstream dependencies.
Configuring Multi-Cloud Monitoring
Many organizations use serverless functions across multiple cloud providers. Centralizing monitoring data provides better operational visibility.
Normalize metrics across providers using a common data format. AWS reports duration in milliseconds, while Azure uses different units. Standardize these before creating cross-platform dashboards.
Implement correlation IDs that flow through multi-cloud function chains. When a user request triggers functions on both AWS and Google Cloud, you need visibility into the entire transaction.
Use infrastructure-as-code tools like Terraform to maintain consistent monitoring configurations across providers. This prevents configuration drift that creates monitoring blind spots.
Creating Effective Status Page Integration
Status pages communicate function health to stakeholders without exposing technical complexity. Users care about service availability, not Lambda error rates.
Group related serverless functions into logical service components. A payment processing service might include functions for validation, charging, and confirmation emails.
Define clear service level indicators (SLIs) based on user experience. "Payment processing completes within 5 seconds" matters more than "Lambda duration stays under 3 seconds."
Automate status page updates based on monitoring data. When error rates exceed thresholds for more than 5 minutes, automatically mark the affected service as experiencing issues.
Setting Up Automated Incident Response
Serverless functions can fail rapidly and at scale. Automated incident response reduces mean time to recovery (MTTR) significantly.
Create runbooks for common serverless issues:
- Timeout increases (check downstream dependencies)
- Error rate spikes (review recent deployments)
- Cold start problems (adjust memory allocation or concurrency settings)
Implement automatic remediation for predictable failures. If a function consistently fails due to memory limits, trigger an automatic memory increase while alerting the development team.
Use chatbots in team communication channels to provide real-time incident status. Team members can query function health without accessing monitoring dashboards directly.
Advanced Monitoring Techniques
Distributed Tracing provides visibility into complex serverless architectures. When one function calls another, which then triggers a third, tracing shows the complete request path.
Implement custom metrics for business logic validation. Beyond technical metrics, track business outcomes like successful order processing or user registration completion.
Anomaly Detection uses machine learning to identify unusual patterns in function behavior. This catches subtle issues that static thresholds might miss.
Correlate function metrics with deployment events. Performance degradation immediately after deployments indicates code-related issues rather than infrastructure problems.
Best Practices for Long-Term Success
Regularly review and adjust monitoring thresholds based on historical data. What seemed like appropriate error rate limits during initial setup might be too aggressive or lenient after months of operation.
Document your monitoring setup thoroughly. Include rationale for threshold choices, escalation procedures, and common troubleshooting steps. This knowledge shouldn't live only in one person's head.
Test your incident response procedures regularly through fire drills. Simulate function failures and verify that alerts fire correctly, status pages update automatically, and team members receive appropriate notifications.
Platforms like Livstat can simplify this complexity by providing unified monitoring and status page management across all your serverless functions, regardless of cloud provider.
Conclusion
Effective serverless function monitoring requires a thoughtful approach that accounts for their unique characteristics. Focus on user-impacting metrics, implement comprehensive synthetic testing, and automate incident response wherever possible.
The key to success lies in treating serverless functions as part of larger service boundaries rather than individual components. Your users interact with services, not individual Lambda functions, and your monitoring should reflect this perspective.
Start with basic monitoring on your most critical functions, then gradually expand coverage and sophistication as your team develops operational expertise with serverless architectures.