How to Set Up Status Page Monitoring for GraphQL APIs
Learn how to implement comprehensive status page monitoring for GraphQL APIs, including query monitoring, schema validation, and real-time incident detection.
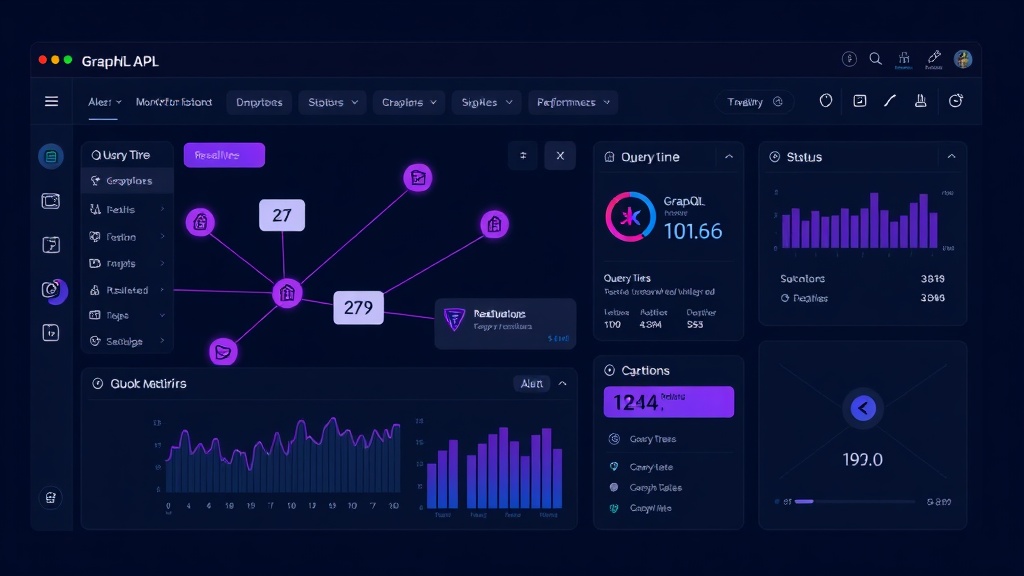
TL;DR: GraphQL APIs require specialized monitoring that tracks query performance, schema health, and resolver errors. This guide covers setting up comprehensive GraphQL monitoring with health checks, query validation, and automated incident detection for your status page.
Understanding GraphQL Monitoring Challenges
GraphQL APIs present unique monitoring challenges compared to traditional REST APIs. Unlike REST endpoints where you monitor specific URLs, GraphQL uses a single endpoint that handles multiple query types and complexity levels.
The flexible nature of GraphQL means clients can request deeply nested data or execute expensive operations that impact performance. Your monitoring strategy must account for query complexity, resolver performance, and schema health to provide accurate status reporting.
Traditional HTTP status codes don't tell the full story with GraphQL. A 200 response might contain partial errors or slow resolver execution that affects user experience.
Setting Up GraphQL Health Checks
Basic Health Check Queries
Start by implementing fundamental health check queries that validate your GraphQL endpoint availability. Create simple queries that test core functionality without adding significant load.
query HealthCheck {
  __typename
  __schema {
    queryType {
      name
    }
  }
}
This introspection query verifies that your GraphQL server responds and the schema is accessible. Set up automated checks every 30-60 seconds to monitor basic availability.
For more comprehensive health validation, create queries that exercise your most critical resolvers:
query CriticalPathCheck {
  user(id: "health-check-user") {
    id
    status
  }
  systemStatus {
    database
    cache
    externalServices
  }
}
Query Performance Monitoring
Implement monitoring for query execution time and complexity. Track metrics like:
- Query execution time (p50, p95, p99 percentiles)
- Resolver performance by field
- Query depth and complexity scores
- Concurrent query volume
Set performance thresholds that trigger status page incidents when exceeded. For example, flag queries taking longer than 5 seconds or complexity scores above your defined limits.
Monitoring GraphQL-Specific Metrics
Schema Health Validation
Your GraphQL schema changes over time, and breaking changes can cause client failures. Monitor schema stability by:
Tracking schema changes through automated introspection queries. Store schema snapshots and compare them to detect breaking changes like removed fields, changed field types, or deprecated resolvers.
Implementing validation rules that check for:
- Deprecated field usage in production queries
- Breaking schema modifications
- Schema parsing errors
- Type system consistency
Error Rate Monitoring
GraphQL errors differ from traditional HTTP errors. Monitor both transport-level errors (HTTP 500s) and GraphQL-specific errors returned in the response body.
Track error patterns by:
- Error type (syntax, validation, execution)
- Specific resolver failures
- Client-specific error rates
- Error location within queries
Set up alerting when error rates exceed baseline thresholds, such as more than 5% of queries returning errors over a 5-minute window.
Query Complexity Analysis
Implement query complexity scoring to prevent expensive operations from overwhelming your system. Monitor:
- Average query complexity per time period
- Peak complexity scores
- Queries hitting complexity limits
- Resource consumption by complexity level
Use tools like graphql-query-complexity to analyze and score incoming queries automatically.
Implementing Real-Time Incident Detection
Automated Alert Configuration
Set up multi-layered alerting that catches different types of GraphQL issues:
Availability Alerts: Trigger when health check queries fail or return errors for more than 2 consecutive attempts.
Performance Alerts: Fire when query response times exceed defined thresholds (e.g., p95 > 3 seconds) for 3+ minutes.
Error Rate Alerts: Activate when GraphQL errors exceed 5% of total queries over a 5-minute rolling window.
Schema Alerts: Notify when schema introspection fails or breaking changes are detected.
Custom GraphQL Monitors
Create specialized monitors for your specific GraphQL implementation:
Monitor subscription connection health for real-time features. Track WebSocket connection stability, subscription error rates, and message delivery performance.
Implement federation-specific monitoring if you use GraphQL federation. Monitor subgraph health, composition errors, and inter-service communication.
Track rate limiting effectiveness and client compliance with your usage policies.
Status Page Integration Best Practices
Component Organization
Structure your status page to reflect your GraphQL API architecture:
- GraphQL Gateway: Overall API availability and response time
- Core Resolvers: Individual resolver performance and availability
- Data Sources: Database, cache, and external service health
- Real-time Features: Subscription and WebSocket connection status
This granular approach helps users understand which features might be affected during incidents.
Incident Communication
Craft incident messages that explain GraphQL-specific issues in user-friendly terms:
Instead of "Resolver timeout in user.posts field," write "Some user profiles may load slowly or incompletely."
Provide workarounds when possible, such as using simpler queries or avoiding specific field combinations during incidents.
Maintenance Window Planning
Plan maintenance windows around GraphQL schema changes and breaking updates. Communicate deprecation schedules and provide migration guidance for affected queries.
Use your status page to announce schema changes, especially breaking modifications that require client updates.
Advanced Monitoring Techniques
Query Analysis and Optimization
Implement query analysis tools that identify performance bottlenecks and optimization opportunities:
Track query patterns to identify frequently requested field combinations. Use this data to optimize resolver batching and caching strategies.
Monitor resolver dependency graphs to understand cascading failure scenarios. When one resolver fails, identify which queries and user experiences are affected.
Client-Specific Monitoring
Segment your monitoring by client application or API key. This approach helps you:
- Identify problematic client behavior
- Provide client-specific status updates
- Track SLA compliance per customer
- Detect abuse patterns or inefficient queries
Federation and Microservices
For federated GraphQL implementations, monitor subgraph health independently. Track composition success rates, cross-service query performance, and federation gateway stability.
Implement circuit breaker patterns that gracefully handle subgraph failures while maintaining partial functionality.
Monitoring Tools and Implementation
Open Source Solutions
Leverage tools like Apollo Studio, GraphQL Inspector, and custom Prometheus metrics for comprehensive monitoring. These tools provide schema tracking, query analysis, and performance insights.
Integrate with your existing observability stack using OpenTelemetry or similar standards for unified monitoring across your infrastructure.
Commercial Platforms
Consider platforms like Livstat that offer built-in GraphQL monitoring capabilities alongside status page functionality. This integrated approach simplifies incident detection and customer communication workflows.
Look for solutions that provide GraphQL-specific features like query complexity analysis, schema change detection, and resolver-level monitoring.
Conclusion
Effective GraphQL API monitoring requires understanding the unique challenges of query-based APIs. Focus on query performance, schema health, and error patterns rather than just endpoint availability.
Implement comprehensive monitoring that tracks resolver performance, query complexity, and schema stability. Use this data to provide transparent status updates and proactive incident communication.
Your monitoring strategy should evolve with your GraphQL implementation, incorporating new resolvers, schema changes, and client usage patterns to maintain reliable service visibility.