Status Page vs Uptime Monitoring Dashboard: Key Differences
Status pages and uptime monitoring dashboards solve different problems. Learn how they differ, when you need each, and why most teams need both in 2026.
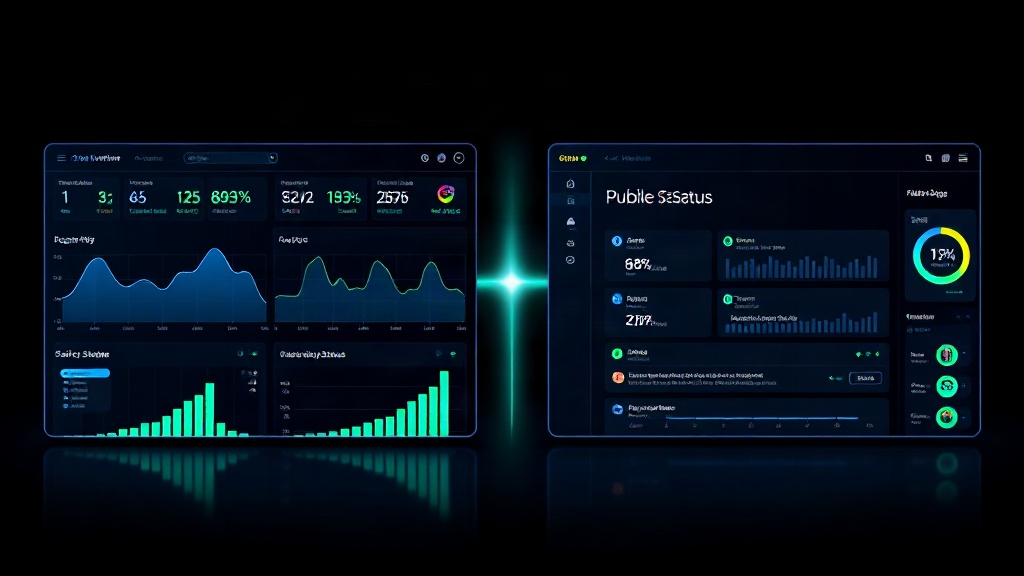
TL;DR: An uptime monitoring dashboard is an internal tool that tracks the health of your systems in real time. A status page is a public-facing communication layer that tells customers what's happening during incidents. They work together — monitoring detects problems, status pages communicate them. Most growing teams need both, and the best setups connect them so incidents update automatically.
If you've ever searched for "status page vs uptime monitoring dashboard," you've probably noticed the terms get used interchangeably in marketing copy. They shouldn't be. Confusing the two leads teams to buy the wrong tool, or worse, to skip a critical piece of their incident response stack entirely.
Let's break down exactly what each one does, where they overlap, and how to decide what you actually need.
What an Uptime Monitoring Dashboard Actually Does
An uptime monitoring dashboard is built for you and your team. It continuously checks your infrastructure — websites, APIs, servers, databases — and shows you real-time health data.
Typical features include:
- Synthetic checks every 30-60 seconds from multiple regions
- Response time graphs and latency trends
- Alerting via email, SMS, Slack, or PagerDuty when a check fails
- Historical uptime data (99.95% this month, for example)
- Root cause context like DNS failures, SSL expiration, or timeout errors
This is your early warning system. It's the tool that tells you a payment API is timing out three minutes before your support inbox fills up with angry tickets.
Crucially, monitoring dashboards are internal by default. Customers never see them, and they shouldn't — raw monitoring data is noisy, technical, and often includes information you don't want public (internal endpoint names, server regions, third-party vendor dependencies).
What a Status Page Actually Does
A status page is a curated, public-facing view of your system's health. It's designed for customers, not engineers.
A good status page includes:
- Component-level status (API, Dashboard, Checkout, Mobile App) shown as operational, degraded, or down
- Incident timelines with human-readable updates ("We've identified the issue and are deploying a fix")
- Scheduled maintenance notices posted in advance
- Subscriber notifications via email, SMS, Slack, or RSS
- Historical uptime and SLA data presented simply, often as a percentage or calendar view
The goal isn't technical accuracy for its own sake — it's trust. According to internal Livstat data, companies that post an update within 5 minutes of detecting an incident see up to 40% fewer support tickets during that outage compared to teams that stay silent for 30+ minutes.
A status page doesn't detect problems. It communicates them, on your terms, in language your customers can actually understand.
The Core Difference in One Sentence
Monitoring answers "is something broken?" A status page answers "what should our customers know right now?"
Those are two different jobs, aimed at two different audiences, and conflating them is where most teams go wrong.
Where the Confusion Comes From
Part of the confusion is historical. Early monitoring tools like Pingdom and UptimeRobot offered basic public status pages as an add-on feature. Early status page tools like Statuspage.io required you to bring your own monitoring and update incidents manually.
That left teams in one of two bad spots:
- Monitoring-only setups where engineers know about an outage but customers find out only after opening a support ticket.
- Status-page-only setups where updates are posted manually, minutes or hours late, because nothing is watching infrastructure automatically.
Modern platforms — Livstat included — have closed that gap by combining monitoring and status pages into a single workflow: a monitor fails, an incident is drafted automatically, and your status page updates in real time without someone manually typing it out.
Do You Need Both? A Practical Framework
Use this checklist to figure out what your team actually needs:
You need monitoring if:
- You have any production system customers depend on
- You want to know about outages before customers report them
- You need historical uptime data for SLA reporting
You need a status page if:
- You have external customers or stakeholders (even just a handful of B2B clients)
- You get repeat support tickets asking "is it just me?" during incidents
- You have contractual SLA commitments you need to report against
- You run scheduled maintenance that affects users
If you checked boxes in both lists — which is nearly every SaaS company, e-commerce platform, or API provider — you need both, connected to each other.
What It Looks Like When They're Connected
Here's the ideal flow, and it's how teams using Livstat typically operate:
- A monitor checks your checkout API every 30 seconds from five global regions.
- Three consecutive failures trigger an alert to your on-call engineer via Slack and SMS.
- The same failure automatically creates a draft incident on your public status page, marking "Checkout" as degraded.
- Your team confirms and adds a human-readable message: "We're investigating elevated errors on checkout. Updates every 15 minutes."
- Subscribers who opted into notifications get an instant email or SMS.
- When the monitor shows recovery, the incident auto-resolves or prompts your team to confirm resolution.
- The incident becomes part of your historical uptime log, feeding SLA reports automatically.
Compare that to a disconnected setup, where an engineer has to notice the alert, then remember to log into a separate status page tool, then manually write and publish an update — often 15-20 minutes after the fact. In an outage, those minutes directly correlate with support ticket volume and customer frustration.
Common Mistakes Teams Make
- Running monitoring with no status page: customers learn about outages from Twitter/X complaints instead of you.
- Running a status page with no automated monitoring: incidents get posted late because someone has to notice manually.
- Using two completely separate vendors: doubles your tooling cost and creates update lag between detection and communication.
- Making the status page too technical: customers don't care about which Kubernetes pod restarted — they care whether checkout works.
Key Takeaway
An uptime monitoring dashboard and a status page aren't competing tools — they're two halves of the same incident response workflow. Monitoring tells you something's wrong; the status page tells your customers what you're doing about it.
If you're currently running one without the other, that's the gap to close first. And if you're running both from separate vendors, look at whether a connected platform like Livstat could eliminate the manual handoff between detection and communication — because in an outage, every minute of lag shows up as a support ticket.