How to Set Up Status Page Monitoring for Machine Learning Pipelines
Learn to monitor ML pipeline health with effective status page strategies. Cover data ingestion, model training, inference endpoints, and automated alerting for robust ML operations.
TL;DR: Machine learning pipelines require specialized monitoring beyond traditional infrastructure. This guide covers setting up comprehensive status page monitoring for ML workflows, including data pipeline health, model performance metrics, inference endpoint availability, and automated incident response. Key focus areas include monitoring data drift, training job failures, and API latency spikes.
Why ML Pipeline Monitoring Differs from Standard Infrastructure
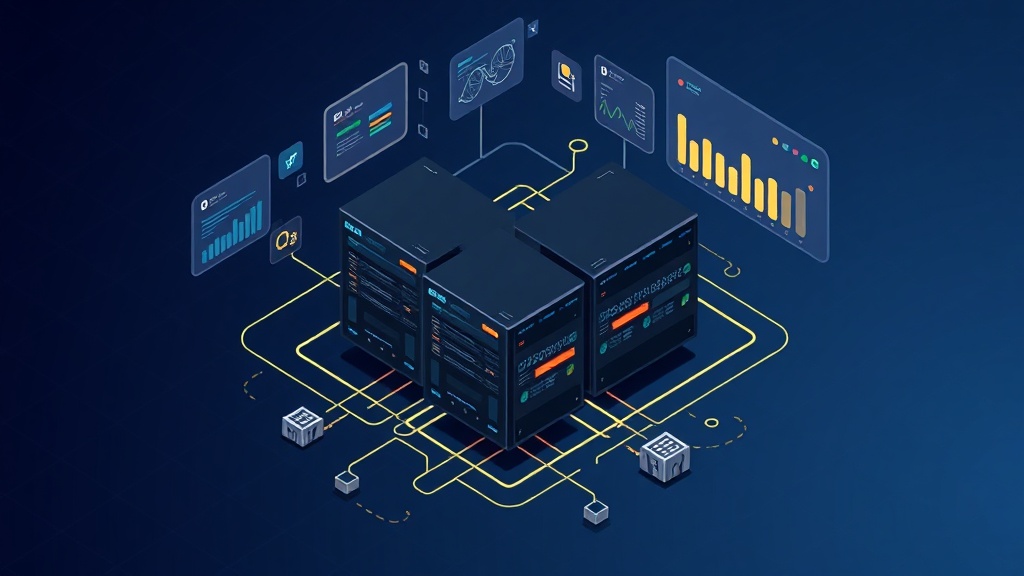
Machine learning pipelines present unique monitoring challenges that traditional infrastructure monitoring can't address. Unlike web applications or databases, ML systems involve complex workflows spanning data ingestion, feature engineering, model training, validation, and deployment.
Your ML pipeline might appear healthy from an infrastructure perspective while suffering from data quality issues, model drift, or training failures. These problems can silently degrade your service quality without triggering traditional uptime alerts.
A recent study by MLOps Community found that 73% of ML projects fail due to operational issues rather than algorithmic problems. This makes comprehensive pipeline monitoring essential for production ML systems.
Core Components to Monitor in ML Pipelines
Data Pipeline Health
Data pipeline failures are the most common cause of ML system outages. Monitor these critical metrics:
- Data ingestion rates: Track whether your system receives expected data volumes
- Schema validation: Alert when incoming data doesn't match expected formats
- Data freshness: Monitor time since last successful data update
- Quality metrics: Track missing values, outliers, and distribution shifts
Set up alerts when data ingestion drops below 80% of expected volume or when schema validation failures exceed 5% of incoming records.
Model Training and Validation
Training job monitoring requires different approaches than traditional application monitoring:
- Training job status: Success, failure, or timeout states
- Model performance metrics: Accuracy, precision, recall, F1-score
- Training duration: Detect unusually long or short training times
- Resource utilization: GPU/CPU usage during training
Consider a training job "degraded" if performance metrics drop 10% below baseline or if training takes 50% longer than historical averages.
Inference Endpoint Monitoring
Your model serving infrastructure needs traditional uptime monitoring plus ML-specific checks:
- Response latency: P95 and P99 response times
- Prediction accuracy: Real-time model performance
- Request volume: Traffic patterns and capacity utilization
- Model drift: Statistical changes in input data distributions
Setting Up Your ML Pipeline Status Page
Step 1: Define Service Components
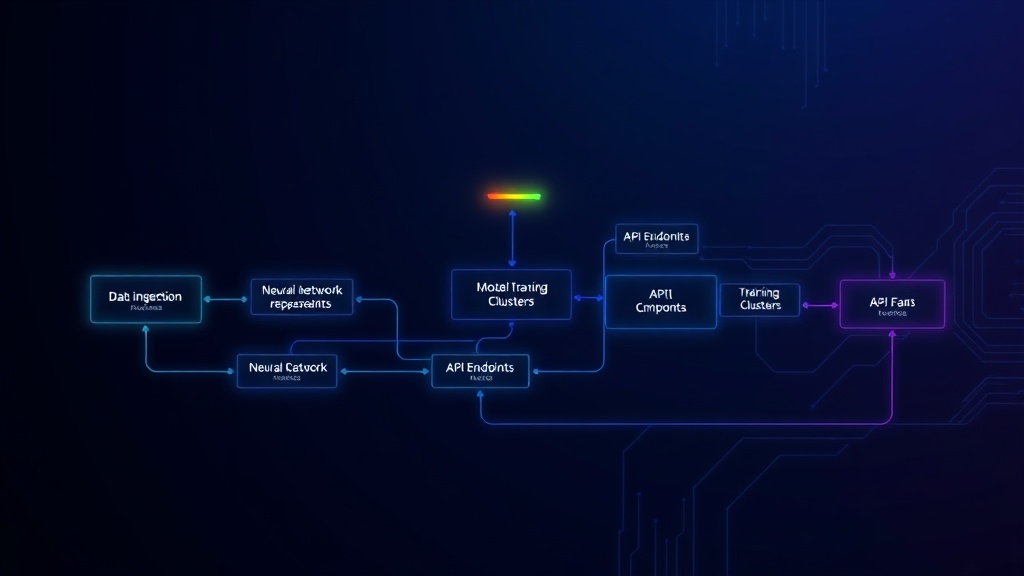
Organize your status page around logical ML pipeline stages rather than technical infrastructure:
- Data Ingestion Services
- Feature Engineering Pipeline
- Model Training Infrastructure
- Model Validation & Testing
- Inference API Endpoints
- Model Monitoring & Drift Detection
This structure helps stakeholders understand which part of your ML workflow might be affected during incidents.
Step 2: Configure Health Checks
Implement health checks that validate both technical functionality and ML-specific requirements:
# Example health check for inference endpoint
def ml_health_check():
    # Standard uptime check
    response = requests.get(f"{API_URL}/health")
    if response.status_code != 200:
        return "DOWN"

    # ML-specific validation
    test_prediction = get_test_prediction()
    if not validate_prediction_format(test_prediction):
        return "DEGRADED"

    if check_prediction_latency() > SLA_THRESHOLD:
        return "DEGRADED"

    return "OPERATIONAL"
Run these checks every 30-60 seconds for real-time inference endpoints and every 5-15 minutes for batch processing components.
Step 3: Establish Status Definitions
Define clear status levels that reflect ML pipeline health:
- Operational: All systems functioning within normal parameters
- Degraded: System functional but performance below SLA (e.g., model accuracy dropped 5-10%)
- Partial Outage: Some components down but core functionality available
- Major Outage: Critical pipeline components unavailable
Step 4: Set Up Automated Monitoring
Configure monitoring tools to track your defined metrics and update status automatically. Popular options include:
- MLflow: For experiment tracking and model performance
- Evidently: For data drift detection
- Seldon: For model serving monitoring
- Custom Prometheus metrics: For pipeline-specific monitoring
Integrate these tools with your status page platform. Services like Livstat can automatically update component status based on your monitoring data, reducing manual overhead.
Advanced ML Monitoring Strategies
Data Drift Detection
Implement statistical tests to detect when your input data distribution changes:
- Kolmogorov-Smirnov test: For continuous features
- Chi-square test: For categorical features
- Population Stability Index (PSI): For overall distribution changes
Trigger "Degraded" status when PSI exceeds 0.1 and "Partial Outage" when it exceeds 0.25.
Model Performance Monitoring
Track model performance in real-time using:
- Ground truth validation: Compare predictions with actual outcomes
- Proxy metrics: Use correlated metrics when ground truth is delayed
- A/B testing results: Monitor champion vs. challenger model performance
Set up automated retraining triggers when performance drops below acceptable thresholds.
Resource and Cost Monitoring
ML pipelines consume significant computational resources. Monitor:
- Training cost per epoch: Detect resource inefficiencies
- Inference cost per prediction: Track serving economics
- Auto-scaling events: Monitor capacity adjustments
Incident Response for ML Systems
Common ML Pipeline Incidents
Prepare response procedures for typical ML system failures:
- Data pipeline failures: Implement fallback to cached data or alternative sources
- Model performance degradation: Automated rollback to previous model version
- Training job failures: Retry logic with exponential backoff
- Inference endpoint overload: Auto-scaling and load balancing
Automated Remediation
Implement automated responses for common issues:
- Model rollback: Automatically revert to previous version when accuracy drops
- Data pipeline restart: Retry failed ingestion jobs with exponential backoff
- Scaling adjustments: Increase inference capacity during traffic spikes
Communication Templates
Create incident templates specific to ML issues:
"We're experiencing elevated error rates in our recommendation engine. Model predictions may be less accurate than usual. Our team is investigating and will provide updates within 30 minutes."
Best Practices for ML Status Pages
Keep It User-Focused
Structure your status page around user-facing functionality rather than technical components. Instead of "Feature Engineering Pipeline - Degraded," use "Recommendation Accuracy - Reduced Quality."
Provide Context for ML Metrics
Explain what degraded ML performance means for users:
- "Search relevance may be lower than usual"
- "Fraud detection sensitivity temporarily reduced"
- "Personalization features may show generic content"
Update Frequency
ML systems can degrade gradually. Update your status page more frequently during incidents (every 15-30 minutes) to keep stakeholders informed.
Historical Context
Maintain incident history that includes ML-specific root causes. This helps identify patterns like seasonal data drift or recurring training failures.
Conclusion
Effective ML pipeline monitoring requires thinking beyond traditional infrastructure metrics. Focus on data quality, model performance, and user-facing functionality when designing your status page.
Start with the core components outlined in this guide, then gradually add more sophisticated monitoring as your ML operations mature. Remember that the goal isn't perfect monitoring coverage—it's providing clear, actionable information about your ML system's health to the people who depend on it.
By implementing comprehensive ML pipeline monitoring in 2026, you'll detect issues faster, respond more effectively, and maintain higher system reliability for your machine learning applications.