How to Set Up Synthetic Monitoring for Web Applications in 2026
Learn how to implement synthetic monitoring for your web apps with practical setup steps and best practices. Catch issues before they impact users.
TL;DR: Synthetic monitoring uses automated scripts to test your web application from the user's perspective 24/7. This guide covers tool selection, script setup, alert configuration, and optimization strategies to catch issues before they affect real users.
What Is Synthetic Monitoring?
Synthetic monitoring simulates real user interactions with your web application using automated scripts. Unlike real user monitoring (RUM) that tracks actual user behavior, synthetic monitoring proactively tests your application's functionality, performance, and availability from predefined locations worldwide.
Think of it as having a robot user constantly clicking through your website, filling out forms, and checking that everything works as expected. When something breaks, you know immediately — often before any real users encounter the problem.
Why Your Web Application Needs Synthetic Monitoring
Traditional uptime monitoring only checks if your server responds to basic HTTP requests. But what if your server is up, but the login form is broken? Or the checkout process crashes halfway through?
Synthetic monitoring catches these critical business logic failures that simple ping tests miss. A 2026 study by WebOps Analytics found that 73% of application issues go undetected by basic uptime monitors, while synthetic monitoring catches 94% of user-facing problems.
Here's what synthetic monitoring can detect:
- Broken user workflows (login, checkout, form submissions)
- JavaScript errors preventing page functionality
- Third-party service failures (payment processors, CDNs)
- Performance degradation in specific regions
- SSL certificate issues
- Database connectivity problems affecting dynamic content
Choosing the Right Synthetic Monitoring Tool
Your tool choice depends on your application complexity, budget, and technical requirements. Here are the main categories:
Enterprise Solutions
- Datadog Synthetics: Comprehensive monitoring with advanced scripting
- New Relic Synthetics: Deep application performance insights
- Dynatrace: AI-powered problem detection
Developer-Focused Options
- Pingdom: User-friendly interface with solid scripting capabilities
- UptimeRobot: Basic synthetic checks with affordable pricing
- Checkly: Code-first approach using Playwright and Puppeteer
Integrated Platforms
Some status page platforms like Livstat include built-in synthetic monitoring, combining incident detection with customer communication in one tool. This reduces complexity and ensures your status page updates automatically when synthetic checks fail.
Setting Up Your First Synthetic Monitor
Let's walk through setting up a comprehensive synthetic monitor for an e-commerce application.
Step 1: Define Critical User Journeys
Start by mapping your most important user paths:
- Homepage load and navigation
- Product search and browsing
- User registration/login
- Add to cart and checkout process
- Account dashboard access
Step 2: Create Your Monitoring Scripts
Here's a basic example using Playwright (works with most synthetic monitoring tools):
const { test, expect } = require('@playwright/test');

test('E-commerce checkout flow', async ({ page }) => {
  // Navigate to homepage
  await page.goto('https://yourstore.com');
  await expect(page.locator('h1')).toContainText('Welcome');

  // Search for product
  await page.fill('[data-testid="search-input"]', 'laptop');
  await page.click('[data-testid="search-button"]');

  // Add product to cart
  await page.click('.product-item:first-child .add-to-cart');
  await expect(page.locator('.cart-count')).toContainText('1');

  // Proceed to checkout
  await page.click('[data-testid="checkout-button"]');
  await expect(page.url()).toContain('/checkout');

  // Verify checkout page loads
  await expect(page.locator('h2')).toContainText('Checkout');
});
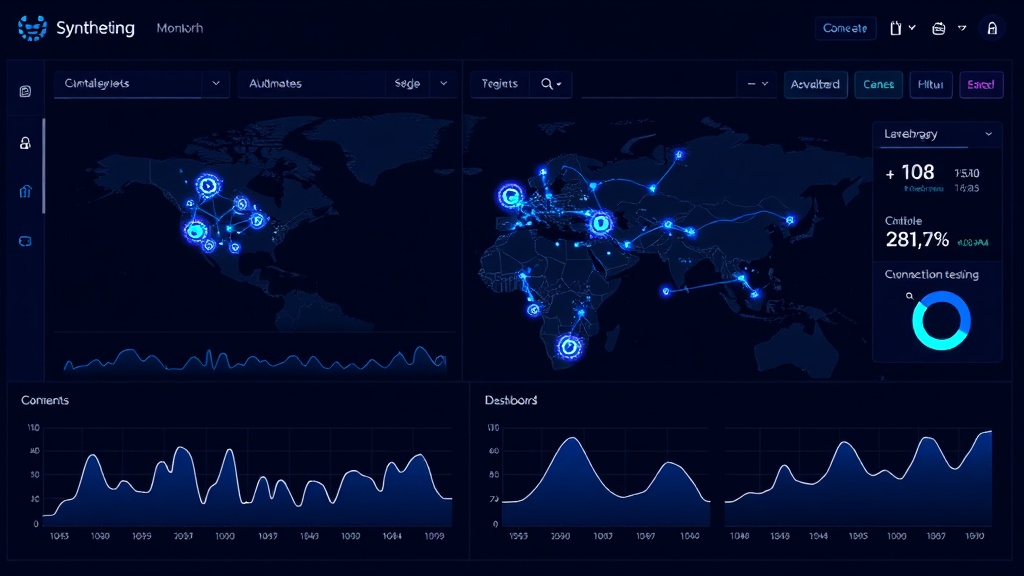
Step 3: Configure Monitoring Locations
Set up monitors from multiple geographic locations to detect regional issues:
- Primary markets: Where most of your users are located
- Secondary markets: Growth regions or backup traffic sources
- Edge cases: Locations with poor connectivity to test worst-case scenarios
Run critical checks every 1-5 minutes from your primary locations, and every 10-15 minutes from secondary locations.
Step 4: Set Performance Thresholds
Define what constitutes acceptable performance:
- Page load time: Under 3 seconds for critical pages
- Transaction completion: Under 10 seconds for multi-step processes
- Error rate: Less than 1% failure rate over 15-minute periods
- Availability: 99.9% uptime for business-critical workflows
Advanced Synthetic Monitoring Strategies
Data-Driven Testing
Use different datasets to test various scenarios:
const testUsers = [
  { email: 'premium@test.com', type: 'premium' },
  { email: 'basic@test.com', type: 'basic' },
  { email: 'trial@test.com', type: 'trial' }
];

testUsers.forEach(user => {
  test(`Login flow for ${user.type} user`, async ({ page }) => {
    await page.goto('/login');
    await page.fill('#email', user.email);
    await page.fill('#password', 'testpass123');
    await page.click('#login-button');

    // Verify user-specific dashboard elements
    if (user.type === 'premium') {
      await expect(page.locator('.premium-features')).toBeVisible();
    }
  });
});
Mobile Monitoring
Configure mobile device emulation to catch mobile-specific issues:
test.use({
  ...devices['iPhone 13'],
  viewport: { width: 390, height: 844 }
});

test('Mobile checkout process', async ({ page }) => {
  // Mobile-specific test logic
  await page.goto('/mobile-checkout');
  await expect(page.locator('.mobile-nav')).toBeVisible();
});
API Monitoring Integration
Combine UI monitoring with API checks for complete coverage:
test('Full stack checkout validation', async ({ page, request }) => {
  // Test API endpoint first
  const apiResponse = await request.post('/api/cart/add', {
    data: { productId: '12345', quantity: 1 }
  });
  expect(apiResponse.status()).toBe(200);

  // Then test UI reflects the change
  await page.goto('/cart');
  await expect(page.locator('.cart-item')).toHaveCount(1);
});
Setting Up Effective Alerts
Alert Prioritization
Configure different alert levels based on business impact:
Critical (P1): Immediate notification
- Complete site down
- Payment processing failures
- Login system unavailable
High (P2): 5-minute delay
- Search functionality broken
- Slow page load times (>5 seconds)
- Individual feature failures
Medium (P3): 15-minute delay
- Minor UI inconsistencies
- Non-critical API slowdowns
- Secondary feature issues
Multi-Channel Alerting
Set up redundant notification channels:
- Slack/Teams: For team coordination
- Email: For documentation and escalation
- SMS/Phone: For critical after-hours issues
- PagerDuty/OpsGenie: For structured incident management
Optimizing Your Synthetic Monitoring
Reduce False Positives
- Retry logic: Automatically retry failed checks 2-3 times before alerting
- Consensus checking: Require failures from multiple locations before triggering alerts
- Maintenance windows: Suppress alerts during scheduled deployments
Performance Optimization
- Conditional checks: Skip non-essential tests based on previous results
- Parallel execution: Run independent checks simultaneously
- Resource management: Use appropriate timeouts and limits
Cost Management
Monitor your synthetic monitoring costs:
- Review check frequency monthly — do you really need 1-minute intervals?
- Optimize script efficiency to reduce execution time
- Use geographic targeting to avoid unnecessary global checks
- Implement smart scheduling for non-critical checks
Measuring Synthetic Monitoring Success
Track these key metrics to evaluate your monitoring effectiveness:
- Mean Time to Detection (MTTD): How quickly you discover issues
- False positive rate: Percentage of alerts that weren't real problems
- Coverage percentage: How much of your application is monitored
- Business impact prevention: Revenue or users protected by early detection
Conclusion
Synthetic monitoring transforms your approach from reactive firefighting to proactive issue prevention. By simulating real user journeys 24/7, you catch problems before they impact customers and maintain the reliability that modern users expect.
Start with your most critical user workflows, gradually expand coverage, and fine-tune your alerting to minimize noise while maximizing protection. The investment in setup time pays dividends in reduced downtime, happier users, and fewer 3 AM emergency calls.