How to Set Up Status Page Monitoring for CDN Performance
Learn how to implement comprehensive CDN monitoring with status pages to track performance metrics, detect issues, and maintain user trust through transparent communication.
TL;DR: Setting up CDN monitoring for your status page involves tracking key metrics like response times, cache hit rates, and origin server health across multiple global locations. Use synthetic monitoring to simulate user requests, implement alerting thresholds, and create automated incident workflows to maintain transparency when CDN issues affect your service.
Why CDN Monitoring Matters for Your Status Page
Content Delivery Networks (CDNs) have become critical infrastructure for modern web applications. When your CDN experiences issues, your users feel the impact immediately through slower load times, failed requests, or complete service unavailability.
Your status page serves as the primary communication channel during these incidents. Without proper CDN monitoring, you might discover performance issues only after users start complaining — damaging both user experience and trust.
A well-configured CDN monitoring system detects problems before they escalate, enabling proactive communication and faster resolution times.
Essential CDN Metrics to Monitor
Response Time and Latency
Track response times from multiple geographic locations to understand how your CDN performs globally. Monitor both the time to first byte (TTFB) and complete resource download times.
Set up monitoring from at least 5-10 different regions where your users are concentrated. This helps identify regional performance degradation that might not affect your origin server.
Cache Hit Rates
Monitor cache hit ratios to ensure your CDN is effectively serving cached content. A sudden drop in cache hit rates often indicates configuration issues or cache purging problems.
Typical healthy cache hit rates range from 80-95% depending on your content type and caching strategy.
Origin Server Health
Your CDN can only perform as well as your origin servers. Monitor origin server response times, error rates, and availability separately from CDN edge locations.
This separation helps distinguish between CDN-specific issues and underlying infrastructure problems.
Error Rates and Status Codes
Track HTTP error rates (4xx and 5xx responses) across different CDN edge locations. Pay special attention to 5xx errors, which often indicate server-side issues.
Monitor specific error codes like 502 (Bad Gateway) and 504 (Gateway Timeout), which commonly occur during CDN or origin server problems.
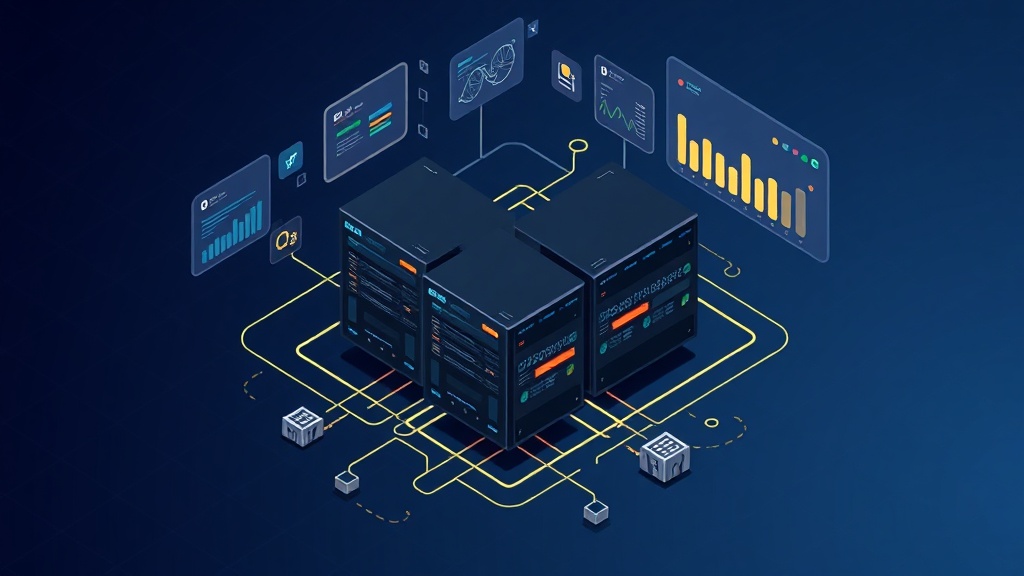
Setting Up CDN Monitoring Infrastructure
Choose Your Monitoring Approach
Synthetic Monitoring simulates user requests from various locations to test CDN performance continuously. This approach catches issues before real users are affected.
Real User Monitoring (RUM) collects performance data from actual user sessions, providing insights into real-world CDN performance.
For comprehensive coverage, implement both approaches. Synthetic monitoring serves as your early warning system, while RUM validates the actual user impact.
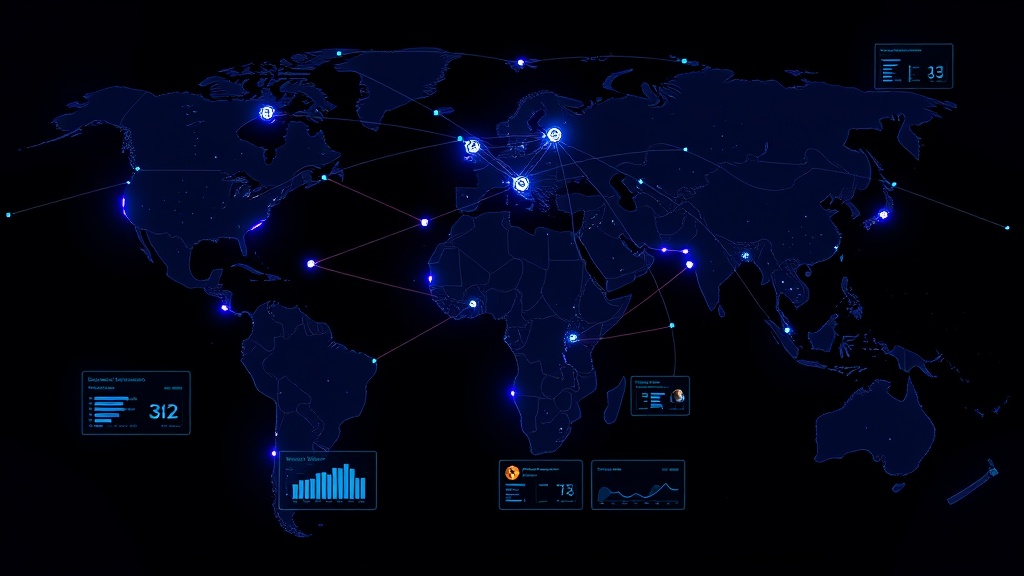
Configure Geographic Distribution
Set up monitoring checks from locations that match your user base distribution. If 60% of your traffic comes from North America, ensure adequate monitoring coverage in that region.
Use monitoring locations that bypass your CDN to test origin server performance directly. This creates a baseline for comparison when CDN issues occur.
Implement Multi-Layer Checks
Create monitoring checks for different content types:
- Static assets (images, CSS, JavaScript)
- Dynamic content (API responses, HTML pages)
- Large files (videos, downloads)
- Critical user flows (authentication, checkout processes)
Each content type has different performance characteristics and potential failure modes.
Creating Effective Alert Thresholds
Response Time Thresholds
Set graduated alert thresholds based on your performance requirements:
- Warning: Response times 50% above baseline
- Critical: Response times 100% above baseline or exceeding 3 seconds
- Emergency: Response times exceeding 10 seconds or request timeouts
Adjust these thresholds based on your specific SLA requirements and user expectations.
Error Rate Thresholds
Implement percentage-based error rate alerts:
- Warning: Error rate above 1% for 5 consecutive minutes
- Critical: Error rate above 5% for 2 consecutive minutes
- Emergency: Error rate above 20% or complete service unavailability
Cache Performance Alerts
Set alerts for cache hit rate degradation:
- Warning: Cache hit rate drops below 70% for 10 minutes
- Critical: Cache hit rate drops below 50% for 5 minutes
Sudden cache performance changes often indicate configuration issues that require immediate attention.
Integrating CDN Monitoring with Your Status Page
Automated Incident Creation
Configure your monitoring system to automatically create status page incidents when critical thresholds are exceeded. This ensures immediate visibility into CDN performance issues.
Define clear criteria for automatic incident creation to avoid false positives while maintaining responsiveness to real issues.
Component-Based Status Updates
Structure your status page with specific components for different CDN-related services:
- Global CDN Performance
- Regional Performance (by geographic area)
- Asset Delivery
- Origin Server Connectivity
This granular approach helps users understand which aspects of your service might be affected.
Performance Metrics Display
Consider displaying key CDN performance metrics directly on your status page. Many users appreciate transparency around response times and system performance.
Platforms like Livstat allow you to showcase real-time performance data alongside traditional uptime information, creating a more comprehensive view of service health.
Best Practices for CDN Status Communication
Incident Classification
Develop clear criteria for classifying CDN-related incidents:
- Minor: Slight performance degradation affecting <10% of users
- Major: Significant performance issues or regional outages
- Critical: Global CDN failures or complete service unavailability
Geographic Specificity
When CDN issues affect specific regions, clearly communicate the geographic scope in your incident updates. Users in unaffected areas appreciate knowing they shouldn't experience problems.
Timeline Expectations
Provide realistic timeline estimates for CDN issue resolution. Network infrastructure problems often take longer to resolve than application issues.
Advanced CDN Monitoring Techniques
Edge Location Health Checks
Implement monitoring that specifically tests individual CDN edge locations. This helps identify problems with specific points of presence (PoPs) that might not show up in aggregate metrics.
Content-Specific Monitoring
Create monitoring checks for different types of content delivery:
- API endpoints served through your CDN
- Static assets like images and stylesheets
- Video streaming performance
- Download speeds for large files
Third-Party Integration Monitoring
Many applications rely on CDN-delivered third-party resources. Monitor the availability and performance of critical external CDNs that your application depends on.
Troubleshooting Common CDN Issues
Cache Invalidation Problems
Monitor cache invalidation effectiveness by checking if content updates propagate correctly across edge locations. Set up alerts for stale content delivery.
SSL Certificate Issues
Track SSL certificate validity across all CDN edge locations. Certificate expiration or configuration problems can cause selective regional outages.
Origin Server Overload
Watch for patterns where CDN cache misses spike simultaneously with origin server stress. This often indicates cache configuration problems or unexpected traffic patterns.
Conclusion
Effective CDN monitoring requires a multi-faceted approach that combines synthetic monitoring, real user metrics, and geographic distribution. By implementing comprehensive monitoring across response times, error rates, and cache performance, you can detect issues before they significantly impact users.
The key to successful CDN monitoring lies in understanding that network performance is inherently distributed and variable. Your monitoring strategy should reflect this complexity while maintaining clear, actionable alerts that enable quick response to genuine issues.
Remember that your status page serves as the bridge between technical monitoring data and user communication. By translating CDN performance metrics into clear, geographic-specific status updates, you maintain user trust even when network infrastructure challenges arise.