How to Set Up Status Page Monitoring for CI/CD Pipelines in 2026
Learn to implement comprehensive status page monitoring for CI/CD pipelines with real-time visibility, automated alerts, and stakeholder communication strategies.
TL;DR: Setting up status page monitoring for CI/CD pipelines requires integrating pipeline webhooks with monitoring tools, configuring automated incident creation for failed deployments, and establishing clear communication channels for development teams and stakeholders. This guide covers webhook integration, alert configuration, and dashboard setup for complete pipeline visibility.
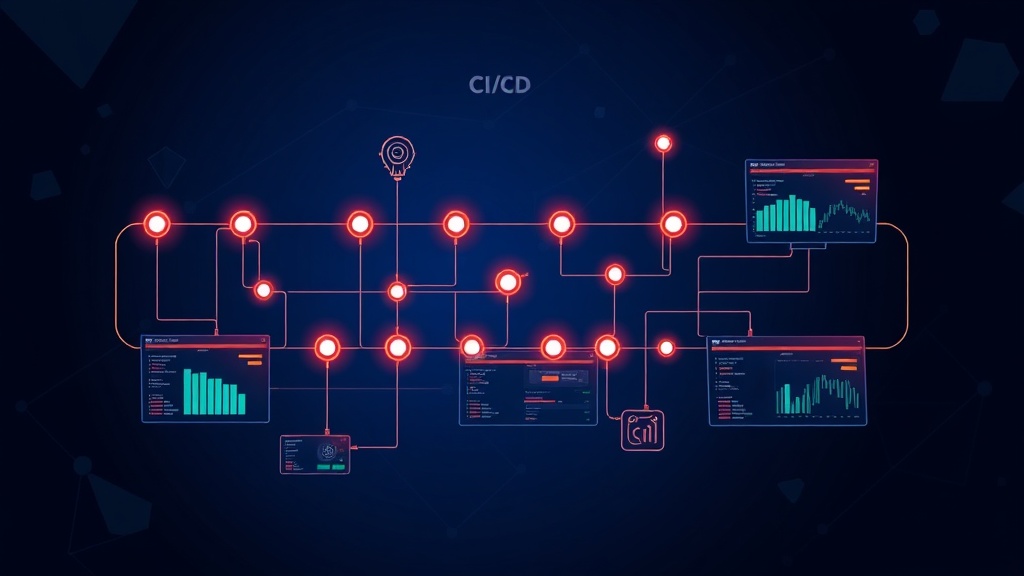
Why CI/CD Pipeline Monitoring Matters
Your CI/CD pipeline is the backbone of your software delivery process. When it breaks, development grinds to a halt, deployments fail, and your entire team feels the impact.
Without proper monitoring and communication, pipeline failures often go unnoticed until developers try to deploy or merge code. This creates frustrating bottlenecks and can delay critical releases by hours or even days.
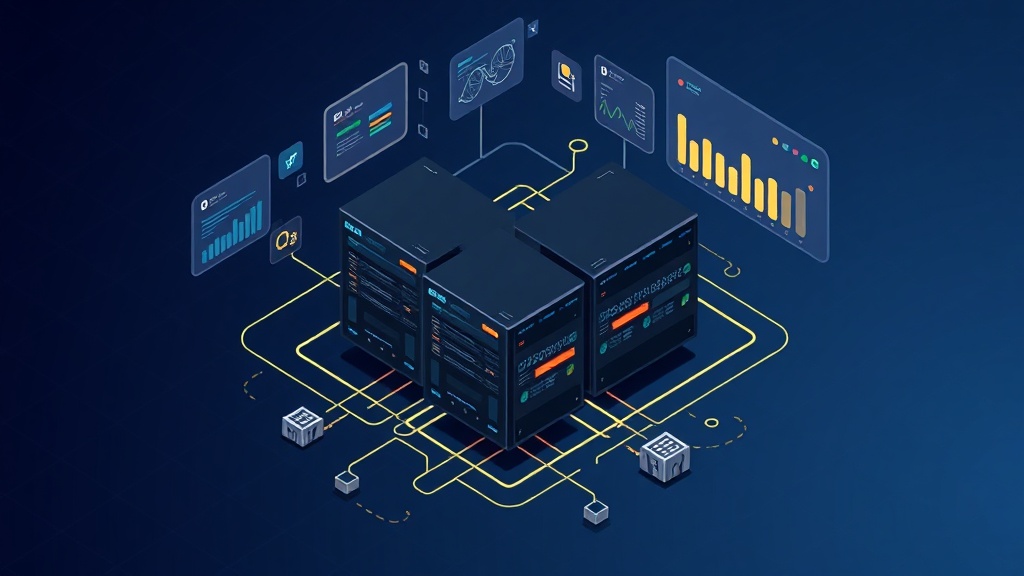
Status page monitoring for CI/CD pipelines provides real-time visibility into your deployment health, automatically alerts relevant teams when issues occur, and keeps stakeholders informed about delivery timelines.
Understanding CI/CD Pipeline Components to Monitor
Before setting up monitoring, identify the critical components of your CI/CD pipeline that require oversight.
Build Stage Monitoring
Your build stage compiles code, runs tests, and creates deployable artifacts. Monitor build success rates, execution time, and resource utilization. Failed builds should trigger immediate alerts since they block all downstream activities.
Track metrics like average build duration, success percentage over time, and queue wait times. These indicators help identify performance degradation before it impacts developer productivity.
Testing Phase Visibility
Automated testing is often the longest part of your pipeline. Monitor test execution time, failure rates by test suite, and flaky test patterns.
Set up alerts for test suite failures, but avoid alert fatigue by grouping related test failures and implementing smart retry logic for intermittent issues.
Deployment Stage Tracking
Deployment monitoring covers multiple environments: staging, pre-production, and production. Each environment requires different alert thresholds and notification strategies.
Production deployment failures demand immediate attention, while staging issues might only require developer notifications during business hours.
Setting Up Pipeline Integration
Webhook Configuration
Most CI/CD platforms support webhooks that fire when pipeline events occur. Configure webhooks to send HTTP POST requests to your monitoring system whenever builds start, complete, or fail.
For Jenkins, navigate to your job configuration and add a "Post-build Action" for webhook notifications. Include relevant metadata like branch name, commit hash, and build duration in the webhook payload.
GitHub Actions users can leverage the workflow_run event to trigger external notifications. Create a separate workflow that listens for completion events and forwards relevant data to your monitoring endpoint.
on:
  workflow_run:
    workflows: ["CI Pipeline"]
    types:
      - completed
API Integration Setup
For platforms without direct webhook support, use their REST APIs to poll pipeline status. Implement a lightweight service that queries pipeline status every few minutes and reports changes to your monitoring system.
Be mindful of API rate limits and implement exponential backoff for failed requests. Most CI/CD platforms provide webhooks, but API polling serves as a reliable fallback option.
Automated Incident Creation
Failure Detection Logic
Not every pipeline failure requires creating an incident. Implement intelligent filtering to distinguish between critical failures and minor issues.
Create incidents for production deployment failures, build failures on main branches, and test failures that block releases. Skip incident creation for feature branch failures or known flaky tests.
Use failure patterns to determine severity levels. A single test failure might warrant a low-severity incident, while multiple consecutive build failures indicate a high-severity issue.
Incident Categorization
Categorize pipeline incidents by stage and impact. Build failures affect developer productivity, test failures might indicate code quality issues, and deployment failures directly impact service availability.
Tag incidents with relevant metadata like affected services, deployment environments, and commit information. This helps teams quickly understand the scope and context of each issue.
Dashboard Configuration
Pipeline Health Overview
Create a high-level dashboard showing overall pipeline health across all projects and environments. Include key metrics like success rates, average execution times, and active incidents.
Use color-coded indicators to show pipeline status at a glance. Green for healthy pipelines, yellow for degraded performance, and red for failed or blocked pipelines.
Detailed Pipeline Metrics
Build detailed dashboards for each major pipeline or service. Show historical trends, recent deployments, and current queue status.
Include deployment frequency metrics to track your team's delivery velocity. Monitor lead time from commit to production and deployment success rates over time.
Team-Specific Views
Different teams need different levels of detail. Developers want immediate feedback on their commits, while managers need high-level trends and delivery metrics.
Create role-based dashboards that surface the most relevant information for each audience. Development teams see build status and test results, while executives see deployment frequency and success rates.
Alert Configuration
Smart Alert Routing
Route alerts based on pipeline stage and impact level. Build failures go to development teams, deployment failures alert both developers and operations, and production issues trigger immediate escalation.
Implement on-call rotations for critical production deployments. Use tools like PagerDuty or Opsgenie to ensure someone always responds to high-severity pipeline failures.
Alert Deduplication
Pipeline failures often cascade, creating multiple related alerts. Implement deduplication logic to group related failures and prevent alert storms.
For example, if a build fails due to a compilation error, don't send separate alerts for downstream test and deployment stages that can't execute.
Escalation Policies
Define clear escalation policies for unacknowledged alerts. Production deployment failures should escalate within 15 minutes, while build failures might escalate after an hour.
Different pipeline stages require different escalation timelines based on their business impact and urgency.
Stakeholder Communication
Automated Status Updates
Automate status updates for planned deployments and maintenance windows. When a deployment pipeline starts, automatically post updates about expected duration and potential service impacts.
Create templates for common pipeline events like scheduled maintenance, emergency hotfixes, and major feature deployments.
Customer-Facing Communication
Decide which pipeline issues warrant customer communication. Production deployment failures definitely require status page updates, while build issues typically don't.
Platforms like Livstat can automatically update your status page when production pipelines fail, ensuring customers stay informed about potential service impacts without manual intervention.
Internal Team Updates
Keep internal teams informed about pipeline health through Slack, Teams, or email notifications. Provide different notification levels based on team roles and responsibilities.
Development teams need immediate notifications about build failures, while business stakeholders only need updates about production impacts or significant delays.
Best Practices and Common Pitfalls
Avoiding Alert Fatigue
Too many alerts reduce their effectiveness. Start with conservative thresholds and gradually tune based on actual incident patterns.
Use alert suppression during known maintenance windows and implement intelligent grouping for related failures.
Monitoring the Monitors
Ensure your monitoring system itself is reliable. If your status page monitoring fails, you lose visibility into pipeline health exactly when you need it most.
Implement heartbeat checks for your monitoring webhooks and create fallback notification channels for critical alerts.
Regular Review and Optimization
Pipeline monitoring isn't set-and-forget. Regularly review alert patterns, adjust thresholds, and update notification routing as your team and infrastructure evolve.
Schedule monthly reviews to identify noise in your alerts and opportunities to improve pipeline reliability through better monitoring insights.
Conclusion
Effective CI/CD pipeline monitoring transforms reactive problem-solving into proactive issue prevention. By implementing comprehensive monitoring with automated incident creation, smart alerting, and clear stakeholder communication, you create a robust foundation for reliable software delivery.
Start with monitoring your most critical pipelines and gradually expand coverage as you refine your processes. Remember that good monitoring pays dividends in reduced downtime, faster issue resolution, and improved team productivity throughout 2026 and beyond.