How to Set Up Uptime Monitoring with Webhook Alerts in 2024
Learn to configure automated uptime monitoring with webhook alerts to get instant notifications when your services go down. Complete guide with setup steps and best practices.
TL;DR: Set up uptime monitoring with webhook alerts by choosing a monitoring service, configuring health checks for your endpoints, creating webhook URLs in your notification tools (Slack, Discord, Teams), and testing the integration. This ensures instant notifications when downtime occurs, enabling faster incident response.
Why Webhook Alerts Matter for Uptime Monitoring
Webhook alerts transform passive monitoring into proactive incident response. Instead of checking dashboards manually or waiting for users to report issues, webhooks push real-time notifications directly to your team's communication channels.
The average cost of downtime is $5,600 per minute for enterprise applications. With webhook alerts, you can reduce detection time from hours to seconds, potentially saving thousands in lost revenue and customer trust.
Webhooks work by sending HTTP POST requests to specified URLs when events occur. For uptime monitoring, this means instant notifications when services go down, come back up, or experience performance issues.
Prerequisites for Setting Up Webhook Monitoring
Before diving into configuration, ensure you have:
- Admin access to your monitoring platform
- The URLs or IP addresses you want to monitor
- Webhook URLs from your notification platforms (Slack, Discord, Microsoft Teams, or custom endpoints)
- Basic understanding of HTTP status codes and response times
Step 1: Choose Your Monitoring Platform
Select a monitoring service that supports webhook integrations. Look for these key features:
- Multiple monitoring locations worldwide
- Customizable check intervals (1-minute minimum recommended)
- SSL certificate monitoring
- Response time thresholds
- Maintenance mode capabilities
Platforms like Livstat offer built-in webhook support with easy integration setup, making the process straightforward even for teams without extensive technical expertise.
Step 2: Configure Your Monitoring Targets
Set up monitors for your critical endpoints:
Website Monitoring
- Add your primary domain (https://yoursite.com)
- Include important subdomains (api.yoursite.com, app.yoursite.com)
- Monitor specific pages with forms or checkout processes
- Set appropriate timeout values (typically 10-30 seconds)
API Endpoint Monitoring
- Monitor REST API endpoints with expected response codes
- Include authentication headers if required
- Set up POST request monitoring for critical write operations
- Configure JSON response validation for data integrity checks
Database and Server Monitoring
- Monitor database connection endpoints
- Set up server health check URLs
- Include load balancer health checks
- Monitor CDN endpoints for static asset delivery
Step 3: Set Up Webhook URLs
Slack Webhook Integration
- Go to your Slack workspace settings
- Navigate to "Apps" and search for "Incoming Webhooks"
- Click "Add to Slack" and select your desired channel
- Copy the webhook URL (format: https://hooks.slack.com/services/...)
- Test the webhook with a simple curl command:
curl -X POST -H 'Content-type: application/json' \
--data '{"text":"Test notification from monitoring setup"}' \
YOUR_WEBHOOK_URL
Discord Webhook Setup
- Open your Discord server and go to Server Settings
- Navigate to Integrations → Webhooks
- Click "New Webhook" and configure the channel
- Copy the webhook URL and save changes
- Test with this payload structure:
curl -X POST -H "Content-Type: application/json" \
-d '{"content": "Monitoring test message"}' \
YOUR_DISCORD_WEBHOOK_URL
Microsoft Teams Integration
- In your Teams channel, click the three dots menu
- Select "Connectors" and find "Incoming Webhook"
- Configure the connector name and upload an optional image
- Copy the generated webhook URL
- Test the integration using the MessageCard format
Custom Webhook Endpoints
For custom applications, create an endpoint that:
- Accepts POST requests
- Processes JSON payloads
- Returns appropriate HTTP status codes (200, 201)
- Implements proper error handling
- Logs webhook events for debugging
Step 4: Configure Alert Rules and Thresholds
Response Time Alerts
Set up graduated alerts based on performance degradation:
- Warning: Response time > 2 seconds
- Critical: Response time > 5 seconds
- Emergency: Complete timeout or connection failure
Availability Thresholds
Configure downtime alerts with smart logic:
- Single failure: Log but don't alert (reduces false positives)
- Two consecutive failures: Send warning notification
- Three consecutive failures: Send critical alert
- Extended downtime (>5 minutes): Escalate to emergency contacts
Geographic Monitoring
Set up location-based alerting:
- Alert when 50% of monitoring locations report issues
- Include location data in webhook payloads for faster troubleshooting
- Configure region-specific escalation for global services
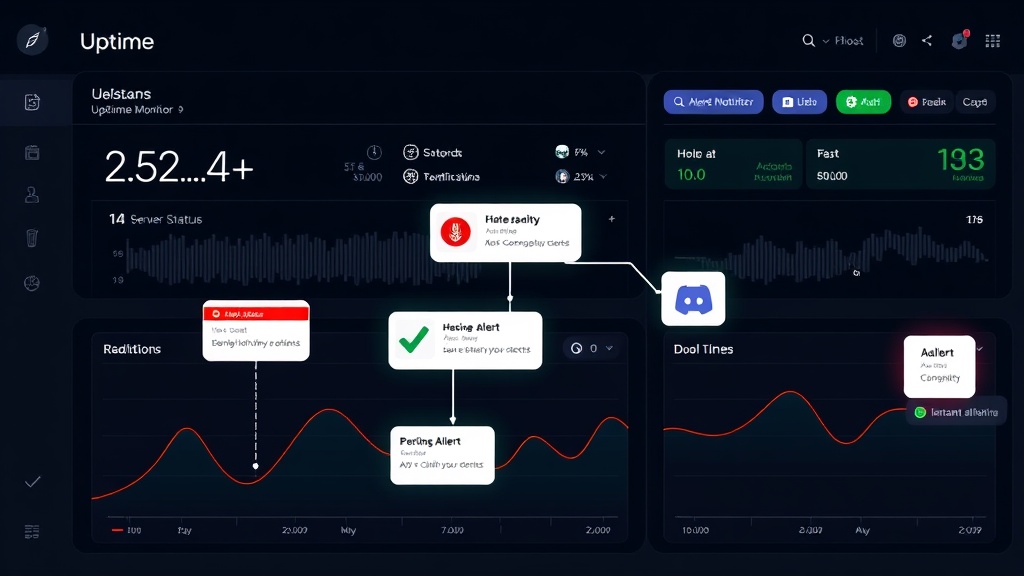
Step 5: Test Your Webhook Integration
Manual Testing
- Trigger a test alert from your monitoring dashboard
- Verify notifications arrive in your designated channels
- Check that alert content includes relevant details (URL, error type, timestamp)
- Confirm that recovery notifications work when services come back online
Automated Testing
Schedule regular webhook tests:
- Monthly webhook connectivity checks
- Quarterly full integration testing
- Annual disaster recovery simulations
Advanced Webhook Configuration
Conditional Alerting
Set up smart filtering to reduce alert fatigue:
- Maintenance mode integration
- Business hours vs. off-hours notification rules
- Severity-based routing to different channels
- User role-based alert distribution
Payload Customization
Enhance webhook payloads with:
- Custom fields for internal tracking
- Runbook links for faster incident response
- Historical context (recent availability percentage)
- Direct links to status pages or dashboards
Rate Limiting and Throttling
Implement smart alerting to prevent spam:
- Maximum alerts per hour limits
- Exponential backoff for repeated failures
- Alert consolidation for multiple simultaneous issues
- Summary reports for extended outages
Monitoring and Maintaining Your Setup
Regular Health Checks
Monitor your monitoring system:
- Verify webhook delivery success rates
- Check for failed webhook attempts
- Monitor notification channel health
- Review alert response times and team acknowledgment rates
Performance Optimization
- Analyze false positive rates and adjust thresholds
- Review geographic distribution of monitoring locations
- Optimize check intervals based on service criticality
- Update contact information and escalation procedures
Documentation and Training
Maintain comprehensive documentation:
- Webhook endpoint configurations
- Escalation procedures and contact lists
- Troubleshooting guides for common issues
- Regular team training on incident response procedures
Troubleshooting Common Issues
Webhook Delivery Failures
Common causes and solutions:
- SSL certificate issues: Verify webhook endpoint certificates
- Network connectivity: Test from monitoring service IP ranges
- Authentication problems: Check API keys and tokens
- Payload format errors: Validate JSON structure and required fields
Alert Fatigue
Prevent notification overload:
- Implement intelligent grouping for related alerts
- Use progressive severity escalation
- Set up maintenance windows for planned updates
- Regular review and optimization of alert thresholds
Conclusion
Setting up uptime monitoring with webhook alerts creates a robust early warning system for your critical services. The key to success lies in thoughtful configuration, regular testing, and continuous optimization based on your team's response patterns.
Start with your most critical endpoints, configure basic webhook integrations, and gradually expand your monitoring coverage. Remember that the goal isn't just detecting downtime—it's enabling your team to respond quickly and effectively to maintain service reliability.
With proper webhook alert configuration, you'll transform from reactive firefighting to proactive service management, significantly improving your mean time to recovery and overall service reliability.